PHD Virtual released new product – PHD Virtual Monitor.
PHD Virtual Monitor 10.0.1 – a new update of the product from PHD Virtual. This product is compatible not only with VMware vSphere, but also with Citrix XenServer. The product can monitor not only the physical hypervisors and their respective VMs, but also the surrounding physical infrastructure (servers, switches, routers…). The application monitoring is also possible where you can get deep look at your applications (running inside of VMs or on physical servers) requires the agent deployment in each VM or physical server.
Supported hypervisor's versions: VMware vSphere 4.x, 5.0, Citrix XenServer 5.5 and 5.6, 6.0
In my Lab I installed the 32 bit version of the Software, and also I deployed few agents in my VMs to see how deep the monitoring can go on for example my Exchange 2010 SP1 server, which runs on a Win 2008R2 VM. Make sure that you use the correct version of the software on your system, because there are 2 different versions available for download – a 32 bit version and 64 bit version.
The installation process is pretty straightforward, and the first thing that the installer does is the .NET 3.5 installation. Make sure that you read the user guide which comes along with the download, because for example the installation process is different for 2008 and 2008R2 OSs, where you must install the .NET Server Add on as a Feature on those servers first, and then you can continue with the installation process.

The installation package contain the Application and very useful PDF files which I used 2 of them: The Install Guide and the User Guide.
After the installation I ended up with an icon to start the program, which asked for license key. I used the “TRIAL” as a key to activate my 15 days trial, which is quite short period for evaluating a program. But at the same time I was offered an NFR license which would make the possibility the evaluation process much longer, so it's not excluded that I'll come back to this in one of my future posts as well.
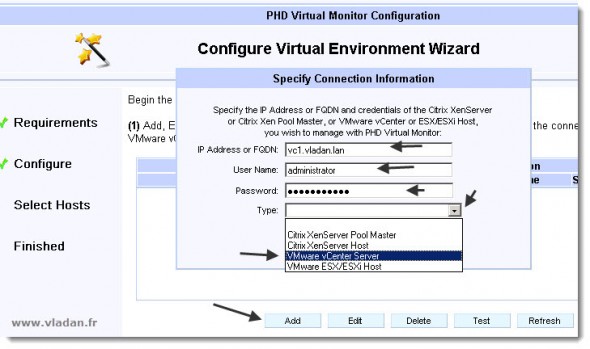
The first thing to do after the installation is done, is to hook up my vCenter. It's a snap. An assistant based screen walks you through to provide your vCenter IP address or DNS name and the credentials for vCenter.
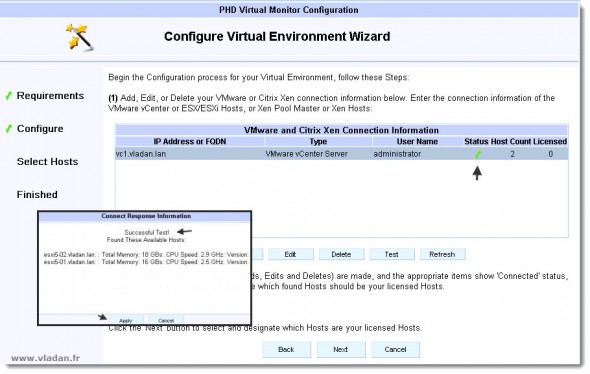
And on the next screen I had the confirmation of the connection too.
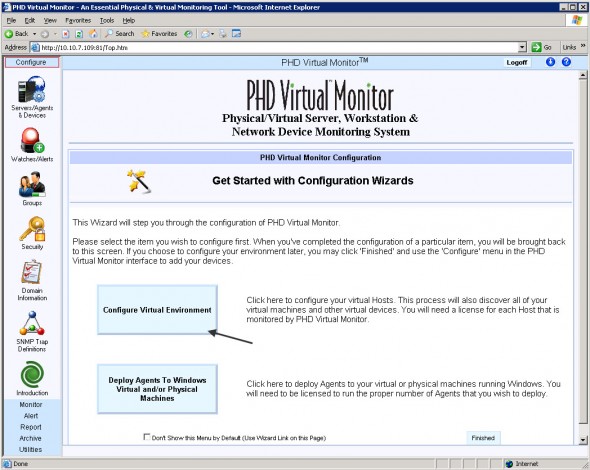
As I said the Installation process wast fast and smooth and I was able to first start the program. As you can see on the screenshot below, the GUI is executed in a default browser. In my case IE6 because I use Windows 2003 Server x32 Virtual Machine to run the software. Even if I found in the manual that IE7 and upwards are the supported browsers only.
But you can also connect remotely by using the https://ip_address_of_the_phd_monitor_server:81 format for the remote connection. Be sure to open in your firewall the ports 81 and 82. Both ports are required in order to remotely access the solution.
As Database, the software uses the SQL Express version which can grow up to 4 gigs of data. And since the auto-purge feature is by default set to enabled and it stores the data for 60 days only, I'd suppose that the size of the database don't get bigger than that. You can access this auto-purge function by clicking the Utilities > Database Maintenance and you can uncheck the button there or setup longer period if you wish.
You can see the feature on the screenshot below:
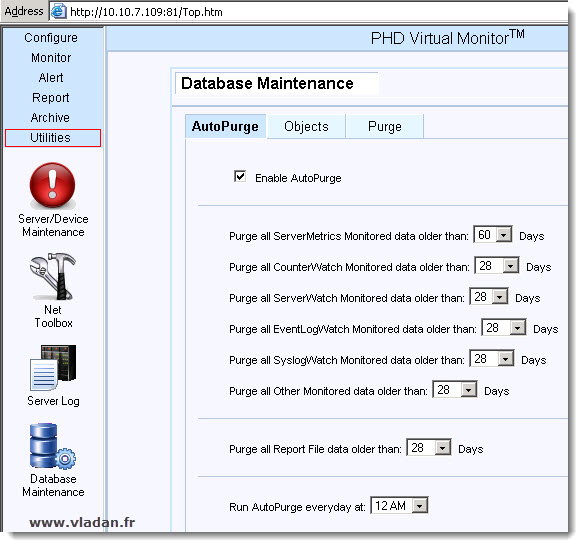
For environments larger than 50 monitored devices, PHD Virtual requires Microsoft SQL Server. All versions of Microsoft's SQL Server are supported. You can find the step-by-step installation instructions in the Installation guide (page 18).
As you can see, on the left hand side there is like an “Outlook” feeling interface, which gives you the possibility to enter into different parts of the user interface. You have several menus at your fingertips which brings you to the options of configure, monitor, alerts, reports, archive and the utilities.
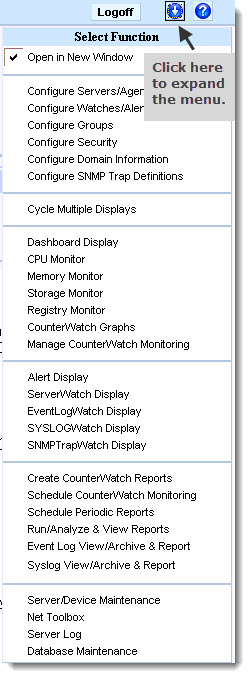 Each time you click on that menu, different Icons appears for each section of that menu. Those Icons gives you the possibility to get deeper in each menu.
But There is another way to go directly to each sub-menu. In fact, if you look at the right top there is a small icon with down arrow. Just click this icon and drop down menu with each of the section and subsection will appear. You can choose to go this way. The pop-up browser window must be enabled in order to use this functionality.
You can use a mufti monitor and launch several browser windows, each with different view. Neat.
I tested the remote access to the PHD Virtual Monitor with Internet Explorer 9.0 version from my laptop running Windows 7 SP1 x64 bit edition. As you know in the W7 x64 there are 2 different versions of IE. And I tested both. At the beginning when you launch the browser with entering the IP address of your PHD Virtual Monitor server followed by the port number, there is an Add On Installation process which installs the ActiveX component, but it just never ended in the 64 bit version of Internet Explorer.
The 32 bit version of IE 9 worked fine.
Anyway. Let's move on with the review. After the initial configuration, which consisted in adding my vCenter, I could successfully deploy agents on few selected VMs in order to monitor some deeper characteristics and metrics. One of those VMs was my Exchange Server 2010 SP1.
The Installation and deployment of agents inside of VMs or Servers needs to be licensed. Monitoring of CPU, Disk, Memory, Network, Processes, EventLogs, Services, Performance Counters and availability is assured by the lightweight agent. And so the agent deployed inside of the VM can pull much more in formations and metrics. There is an assistant for the deployment of the agent.
You're able to monitor over 2,000 local and remote physical and virtual servers/devices with this solution.
The vCenter Integration – During the initial setup and hooking up to my vCenter I had the possibility to deploy the vCenter plugin.
The vCenter plugin is visible as a new Icon when you are on the Home section in the vCenter. And when clicking that icon you open the main page with the main icon set of PHD.
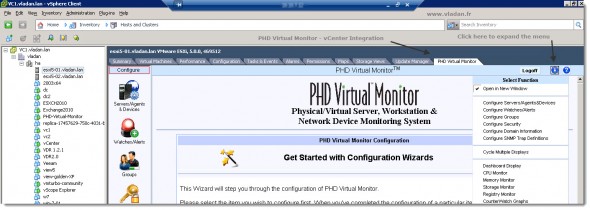
By clicking the Home > Hosts and Clusters in vCenter, the PHDVM is actually showing as a new TAB in vCenter. By clicking on the TAB you can also access to the different sub-menus are accessible through there too.
You can see the setup of my vCenter and the access of those menus in the screenshot below. A very convenient way the integration is done. Click on the image for larger view.
There is a Quick Start Guide link as well in case you need some help in order get started. The link is available on the Start Page and it's called
“Get Started with Quick Start”.
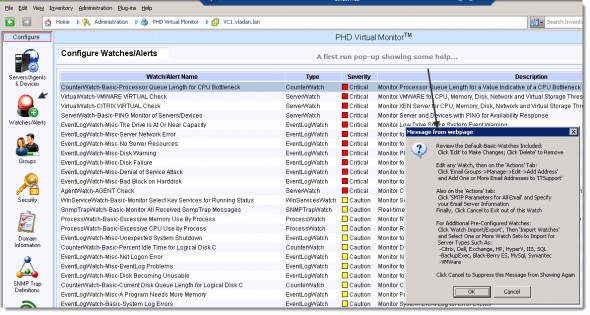
On the Watches/Alerts sub-menu you can see the default alarms/metrics which are monitored. But when first accessed, you have a little pop-up window which shows you the possibility to configure your own alarms as well. Disabling this pop-up for future apparition is of course possible by clicking on the cancel button.
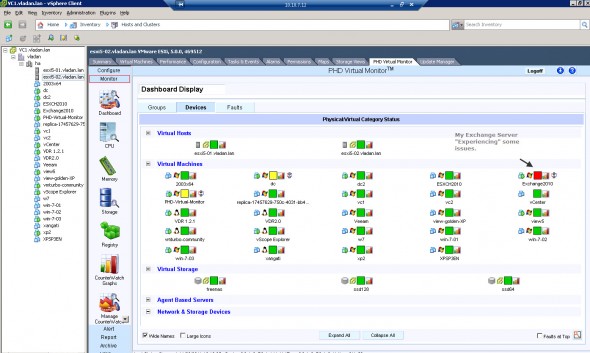
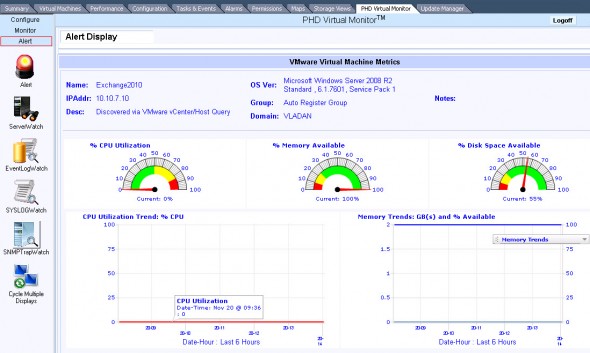
Monitor – the monitoring capabilities are accessed through the Monitor menu. The first Icon on the list. By clicking the Dashboard button, you'll get the whole picture of your infrastructure. The health and (if) problems detected. In my case the system correctly detected an issue on my Exchange Server 2010 where I experienced some temporarily CPU bottlenecks.
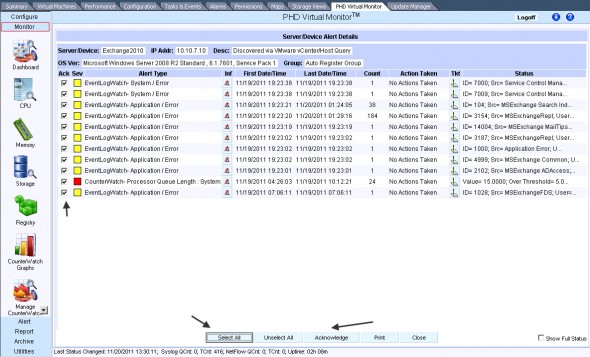
And of course, when you click on the server (or workstation) of your choice, you can drill down deep to see what is actually happening. To get the details, it's enough to hold the mouse over the event, or you can also click the Inf column in the row to get a pop-up with the details. And also select all the events and acknowledge all the events there. Click on the image bellow to see bigger picture.
You can monitor CPU, Memory, Storage Registry and also creating and viewing real-time (or historical) charts of your VMs and Servers.
Alerts – The alerts section, obviously manages and shows alarms which can be coulpled with an WAV audio to have a real Alert in case of some particular alarm setting.
There is a SyslogWatch button which receives the syslog messages from my 2 ESXi hosts. So the server acts as a destination for the collection of those syslog messages.
The other icons are Server Watch which reports a Real Time issues. EvenLogWatch – for use with agents installed in a VMs, get your detailed informations on what's happening on the VM level, because the agent pulls much more informations.
You can also configure SNMP so the PHD VM can became the destination for sending SNMP Traps for your device which are being monitored.
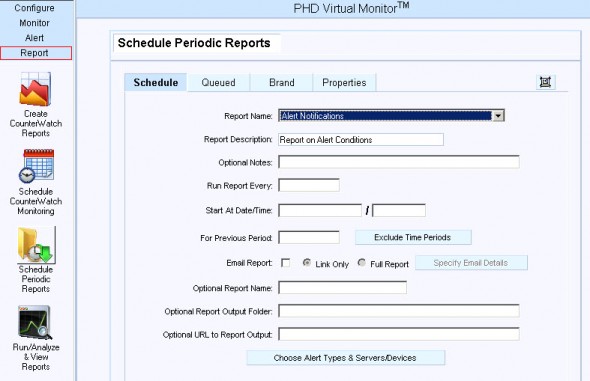
Reports – The reporting can be accessed through the Reports Menu and there you can see the different possibilities. You can create your own reports for different VMs, Servers, Hosts or you can also schedule the execution of those reports by the Schedule CounterWatch Monitoring icon.
Those reports can be delivered to one or several other e-mail adress, and also you can create different report types for different e-mail addresses. So for example the storage team could be alerted on some storage issues while the IT virtualization team would get alerted when troubles are on the VM or the applications side.
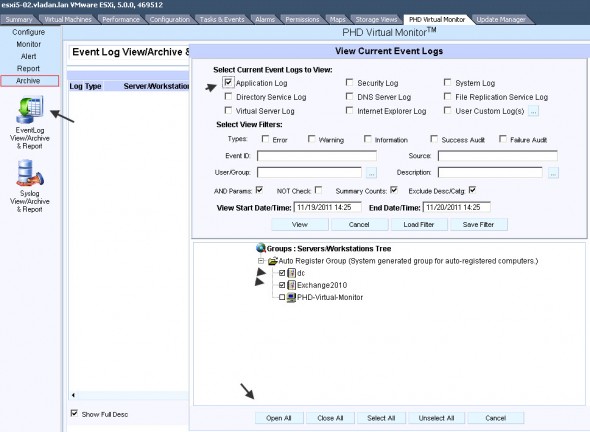
Archive – In my lab setup I was able to implement the solution only during few days, so I don't have any historical data to show you. But as far as I could see there is an option also which permits to look in the archives.
Go to Archive > EventLog View/Archive & Reports – there you have the possibility to view archived logs, monitored events, curent event logs, set the maximum file size or Manage archive schedules.
The Syslog View/Archive & Report permits you, as you might already figured out, the possibility to archive the syslog messages or view the monitored syslogs.
Conclusion:
The PHD Virtual Monitor is easy 5-10 minutes deploy operation if you have a server (or VM) ready to deploy the solution to. The configuration steps can be achieved by using the Installation and configuration guide fairly quickly too. Then the User guide might be your friend in order to configure the solution to fits your environment the way you like it.
In my small lab I was able to test some features, and they all worked immediately. I wasn't able to test everything, but it seems a very lightweight solution for monitoring even large environments (if coupled with Microsoft SQL Server as a database solution). The how-to configuration for installation with Microsoft's SQL is well documented in the Installation Guide.
If you're Citrix Xen Server User, the installation guide will walk you through as well, since the deployment options for Citrix are included in the same PDF document.
I haven't reviewed any concurrent solutions on the market, but for me it worked and I could pull some really deep information from VMs which were quick-deployed with those lightweight agents. The lightweight web interface is pleasant to navigate and browse.
Please note that this review was sponsored by PHD Virtual.

All that and nothing about cost or license model?
Brad,
Well, you can easily find it on the PHD website.