
How to manage vMA logs with Splunk
This is a guest post by Andy Grant.
Managing syslog messages in nearly any size of environment can be daunting. Aside from the effort configuring every client to send syslog messages to your target server, searching for relevant data can be just as challenging. There are many articles online on how to use VMware's vSphere Management Assistant for collecting your ESX/i host syslog messages and naturally, after reading such an article the first thing I did was to jump into my lab and setup vilogger. But then what? While it was nice to have all my logs in one location, I still had to manually search through the files using some conglomeration of cat, ls, less and grep.
Having been introduced to Splunk a number of years ago, and using it on and off since then, playing a little but barely getting my feet wet. David Convery has a great document on VIOPS describing one way to exported individual ESX/i host syslog messages to Splunk, but it is not always administratively efficient to configure each and every host and my memory never served me well enough to be a PowerCLI master. So why not marry the best of both worlds, and use vMA to consolidate the logs and then ship them off to Splunk with one fell-swoop.
I will be starting with the assumption that you have successfully deployed and configured your vMA appliance and configured vilogger.
The first step is to download a free copy of Splunk from Splunk.com. The people at Splunk provide a very handy wget snippet that we can run right from our vMA appliance.

Next, install Splunk

Next, we start the Splunk daemon
$ /opt/splunk/bin/splunk start –accept-license –answer-yes –no-prompt
Now to discuss a few options. By default, Splunk installs the full-blown application, web search and database engine, you may or may not want to run the full stack from vMA. I would actually recommend against using the default installation and we will focus on using the Splunk Light Forwarder to send our syslog data to an existing Splunk installation. If you don't already have a Splunk installation, getting one up and running is a simple as show above then enable the receiving of our data inputs. See Installing Splunk on Linux or Installing Splunk on Windows on Splunk.com for details, and don't forget to enable receiving.
Enable the Splunk Light Forwarder using the default credentials of admin/changeme.
$ sudo /opt/splunk/bin/splunk enable app SplunkLightForwarder -auth admin:changeme –accept-license –answer-yes –no-prompt
To change the default password;
$ sudo /opt/splunk/bin/splunk edit user admin -password NEW_PASSWORD -roles admin -auth admin:changeme
Next we want to ensure that Splunk starts on bootup.
$ sudo /opt/splunk/bin/splunk enable boot-start
We need to add the log directory we wish to monitor, in this case /var/log/vmware is the path of all our syslog collection. To do this we need to edit our inputs.conf located in /opt/splunk/etc/system/local/ by breaking out or favorite text editor.
$ sudo vi /opt/splunk/etc/system/local/inputs.conf
Add the following section:
[monitor:///var/log/vmware]
blacklist = .(gz|bz2|z|zip)$
blacklist = vma
recursive=yes
host_regex = /var/log/vmware/(S+/)
We are doing a few things here. Not only are we setting recursively monitoring the log directory, but blacklisting rotated logs, and parsing the hostname out of the file path (forgive my poor regex, your comments welcome here to get rid of the trailing “/” in the Hosts screenshot below). I am also blacklisting the hostname of my vMA appliance to reduce my logging amount and stay within the daily free license limit.
After any changes to your inputs.conf you will need to restart Splunk.
$ sudo /opt/splunk/bin/splunk restart
We are now monitoring the logs collected by vMA and will forward them to the full-blown Splunk installation.
$ sudo /opt/splunk/bin/splunk add forward-server <Splunk-server-IP_or_FQDN>:9997 -auth admin:changeme
Now point your web browser to your Splunk installation

Your hard work will be rewarded by new entries in Splunk, each file indexed will be listed as a new host. When you first enable your vMA to forward syslog to Splunk, it will perform a complete index of all stored log files. Depending on the number of hosts you are collecting logs from and the length of time you store them, this may push you past the limit imposed by the free version of Splunk of 500MB per day. Use the Deployment Monitor to get a handle on your data inputs.
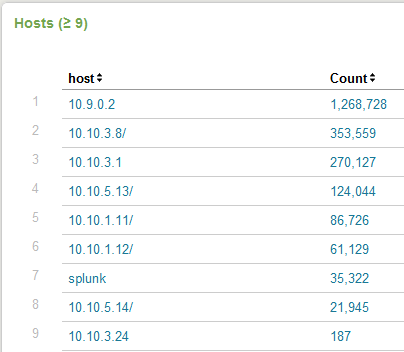
(As you can see my nested ESX hosts are not using DNS resolution).
And there you have it, you can now use Splunk to search, correlate and report on your VMware environments syslog data. Try it out!

Splunk has a great community user base, fabulous documentation and quite possibly some really exciting VMware apps in the pipeline. Stay posted.
Doh, you beat me to it, this was to be my next project, although I was going down the Windows Server route rather than vMA. I will still carry on with it tho (I am looking at Snare for the Windows guests as well).
Hi EV
I too started using the Windows route, it is by far the easiest to setup your first Splunk server that way. I would highly recommend you look into using the Splunk Light Forwarder instead of Snare.
It would be good to see an article on setting up a Splunk server for the first time, ultimately I transitioned to CentOS for mine.
Using a Splunk Forwarder is very reliable for moving data around as it will eat not only eventlogs (and do proper GUID resolution) but any kind of data. If you’re thinking about using a forwarder and you don’t need local filtering, try the “Splunk Universal Forwarder”. Headless and even lighter-weight than the “Light Forwarder”.
Michael Wilde
Splunk Ninja
The Light Forwarder is definitely the way to go. I am no-where near being a Splunk Ninja, but the docs are fabulous!
Two words Andy.
EFFING SHWEET!
Thanks Michael
I have a spunk server setup and sent the sys logs from esxi 4.1. My only problem is the three hosts log 600+ MB a day. It just doesn’t seem scalable. Do you have any thoughts on this?
I had a similar problem at first. The key for me was to blacklist the hostname of the vMA appliance. It had to deal with log rotation and the way the vMA gzips the old logs (it was re-indexing all the other ESX host logs). It showed up pretty clearly in the search I posted in the screenshot with the vMA host accounting for the most events.
Not sure if that is related to your particular setup, 600+MB seems like a LOT for three hosts.
Splunk scales like a champ, but if there’s a chance you’re using the free version of Splunk limited at 500MB/day there are some ways to filter out data you might deem unnecessary.
I concur with Michael.
Install the Deployment Monitor and under License Usage –> Usage Statistics sort by hosts for the last 24 hours to determine who is sending the most data. Filter (blacklist/whitelist) as necessary.
One more thing… to add to Andy’s comment. When you install Splunk 4.2.1 it will allow you to “enable” the Deployment Monitor. Which at first, seems sweet. But there’s an upgrade available. Go to “Manager –> Apps” and you’ll see a “Overwrite with 4.2.2” message under Deployment Monitor. Go for it. You will not be warned, but you NEED TO RESTART SPLUNK. If you don’t, you won’t see a new dashboard view called “License Report”. When we came out with Splunk 4.2, the “peak usage stuff” got moved out of License Manager–and in to the Deployment Monitoring app (which is the right place for it). However, we overlooked some much needed reports and I had them added. Please upgrade, and thanks for diggin splunk!
Awesome! very nice post! now if only I could get an EA License for Spunk I would be set!
Wouldn’t we all 🙂
Great post Andy!
How would you compare Splunk+vMA to VMware vCOps?
Thx,
Didier
Hi Didier
I have vCOps Std in my lab and I really find little comparable between the two. vCOps Std analyzes performance metrics that syslog does not monitor. Perhaps the Configuration Management portion of vCOps Enterprise Edition might provide greater similarities however I have not yet had any exposure to Enterprise Edition. Splunk could very well provide change management and audit trail alerts that you do not get in vCOps Std.
There may be more merit to revisit this come the release of the VMware for Splunk app (speculation on my part) whenever that may be.
Andy
Splunk User Conference is coming up in August… lots of goodness coming. VMware app? Dunno.. we’ll see!