
In today's Objective we'll discuss VCP6-DCV Objective 7.4 – Troubleshoot and Monitor vSphere Performance. You can check the whole VCP6-DCV Study Guide page for all topics there.
You can also check the vSphere 6 page where you’ll find many how-to, videos, and tutorials about vSphere 6.
Performance is a key to everything. When your application is slow, you must pinpoint many values to find out what's going on at your virtual infrastructure.
If it's the underlying VM which is experiencing problems (wrong sizing of CPU, Memory, Disk…) or is it the underlying storage system, network or physical CPU of the host. Quite complex to find out what's going on.
vSphere Knowledge
- Describe how Tasks and Events are viewed in vCenter Server
- Identify critical performance metrics
- Explain common memory metrics
- Explain common CPU metrics
- Explain common network metrics
- Explain common storage metrics
- Identify CPU/Memory contention issues
- Identify Host Power Management Policy
- Monitor performance through esxtop
- Troubleshoot Enhanced vMotion Compatibility (EVC) issues
- Troubleshoot virtual machine performance via vRealize Operations
- Compare and contrast Overview and Advanced Charts
—————————————————————————————————–
Describe how Tasks and Events are viewed in vCenter Server
Tasks
You can view tasks that are associated with a single object or all objects in the vSphere Client inventory. The Tasks & Events tab lists completed tasks and tasks that are currently running. By default, the tasks list for an object also includes tasks performed on its child objects. You can filter the list by removing tasks performed on child objects and by using keywords to search for tasks.
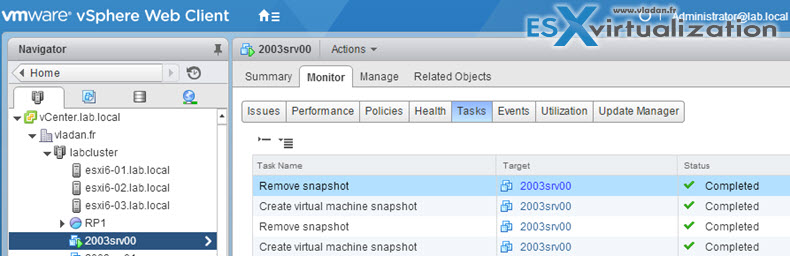
Select Host, VM, Datastore or network TAB > Below, Select object on the left > Monitor TAB > Tasks.
You can also select cluster, datacenter or vCenter object to see the tasks…
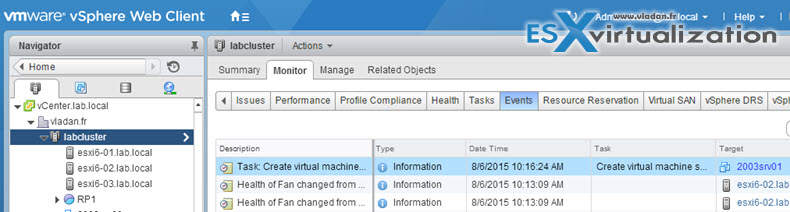
Events
The same for events. Example showing the events at the cluster level. Again, you can choose another object like host, datastore, VM….
Identify critical performance metrics
Explain common memory metrics
Memory overhead – this metrics shows how much memory is necessary for the ESXi to be able to run a VM workload.
Active guest memory – is amount of memory that VMkernel thinks that it has been used by VM actively.
Host memory (consumed) – amount of memory allocated to a VM
Host memory (overhead) – is amount consumed for the virtualization overhead to run this particular VM.
Avg Memory Usage in KB – similar to Average CPU Usage, this should be reported at both Host and Guest levels. It can give you an indication in terms of who is using the most memory but high usage does not necessarily indicate a bottleneck. If memory usage is high, check the values for Memory Ballooning/Swapping.
Balloon (KB) – MCTL – Host cannot meet its memory requirements, so there is a memory pressure on the host. The Balloon driver is installed via VMware Tools onto Windows and Linux guests and its job is to force the operating system, of lightly used guests, to page out unused memory back to ESX so it can grand more memory to other VMs.
Swap Used KB – if you see values being reported at the Host for Swap, this indicates that memory demands cannot be satisfied and processes are swapped out to the vSwp file. This is going bad as swapping is the last resort for the hypervisor to manage the memory at some point… Consider vMotioning some VMs out of this host or plan to add more physical RAM….
Consumed – Consumed memory is the amount of Memory Granted on a Host to its guests minus the amount of Memory Shared across them. Memory can be over-allocated, unlike CPU, by sharing common memory pages such as Operating System pages. This metric displays how much Host Physical Memory is actually being used (or consumed) and includes usage values for the Service Console and VMkernel.
Active – this metric reports the amount of physical memory recently used by the guests on the Host and is displayed as “Guest Memory Usage” in vCenter at Guest level.
From vSphere Monitoring and Performance guide p. 136
- SWR/s (MB) – Rate at which the ESXi host swaps in memory from disk for the resource pool or virtual machine.
- SWW/s (MB) – Rate at which the ESXi host swaps resource pool or virtual machine memory to disk.
- SWCUR (MB) – Current swap usage by this resource pool or virtual machine.
- SWTGT (MB) – Target where the ESXi host expects the swap usage by the resource pool or virtual machine
to be - MCTL? – Check if the memory balloon driver is installed or not. N means no, Y means yes.
- MCTLSZ (MB) – Amount of physical memory reclaimed from the resource pool by way of ballooning.
- MCTLTGT (MB) – Amount of physical memory the ESXi system attempts to reclaim from the resource pool or virtual machine by way of ballooning.
- MCTLMAX (MB) – Maximum amount of physical memory the ESXi system can reclaim from the resource pool or virtual machine by way of ballooning. This maximum depends on the guest operating system type.
Explain common CPU metrics
vSphere Monitoring and Performance guide p. 131
- %USED – Percentage of physical CPU core cycles used by the resource pool, virtual machine, or world. %USED might depend on the frequency with which the CPU core is running. When running with lower CPU core frequency, %USED can be smaller than %RUN. On CPUs which support turbo mode, CPU frequency can also be higher than the nominal (rated) frequency, and %USED can be larger than %RUN. %USED = %RUN + %SYS – %OVRLP
- %RDY – Percentage of time the resource pool, virtual machine, or world was ready to run, but was not provided CPU resources on which to execute. 100% = %RUN + %RDY + %CSTP + %WAIT
-
%CSTP – Percentage of time a resource pool spends in a ready, co-deschedule state. NOTE You might see this statistic displayed, but it is intended for VMware use only.100% = %RUN + %RDY + %CSTP + %WAIT
-
%SYS – Percentage of time spent in the ESXi VMkernel on behalf of the resource pool, virtual machine, or world to process interrupts and to perform other system activities. This time is part of the time used to calculate %USED. %USED = %RUN + %SYS – %OVRLP
-
%WAIT – Percentage of time the resource pool, virtual machine, or world spent in the blocked or busy wait state. This percentage includes the percentage of time the resource pool, virtual machine, or world was idle. 100% = %RUN + %RDY + %CSTP + %WAIT
Explain common network metrics
vSphere Monitoring and Performance guide p 141.
- MbTX/s –MegaBits transmitted per second.
- MbRX/s -MegaBits received per second.
Dropped packed metrics:
- %DRPTX – Percentage of transmit packets dropped
- %DRPRX – Percentage of receive packets dropped.
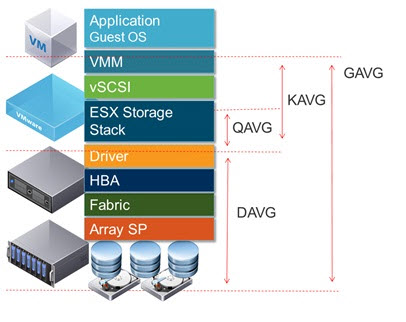
Explain common storage metrics
Latency, latency, latency…
- GAVG (Guest Average Latency) total latency as seen from vSphere
- KAVG (Kernel Average Latency) time an I/O request spent waiting inside the vSphere storage stack.
- QAVG (Queue Average latency) time spent waiting in a queue inside the vSphere Storage Stack.
- DAVG (Device Average Latency) latency coming from the physical hardware, HBA and Storage device.
Identify CPU/Memory contention issues
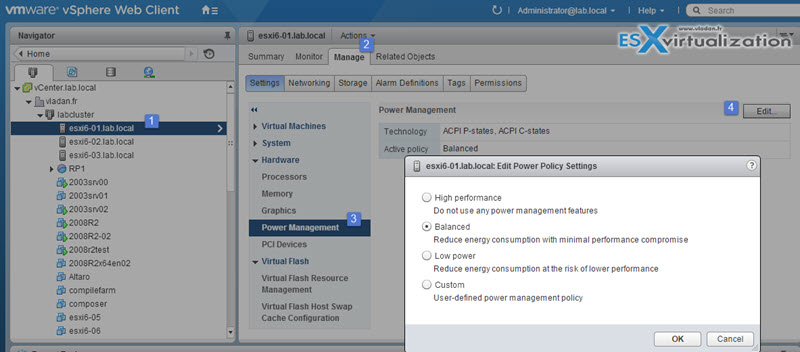
Identify Host Power Management Policy
- High Performance – This power policy maximizes performance, using no power management features. It keeps CPUs in the highest P-state at all times. It uses only the top two C-states (running and halted), not any of the deep states (for example, C3 and C6 on the latest Intel processors).
- Balanced – This power policy is designed to reduce host power consumption while having little or no impact on performance. The balanced policy uses an algorithm that exploits the processor’s P-states. Balanced is the default power policy for ESXi.
- Low Power – This power policy is designed to more aggressively reduce host power consumption, through the use of deep C-states, at the risk of reduced performance.
- Custom – This power policy starts out the same as balanced, but it allows individual parameters to be modified. If the host hardware does not allow the operating system to manage power, only the Not Supported policy is available. (On some systems, only the High Performance policy is available.)
Monitor performance through esxtop
Check this community thread ESXTOP. It's excellent!
Troubleshoot Enhanced vMotion Compatibility (EVC) issues
From this VMware KB – EVC and CPU Compatibility FAQ you can learn that:
EVC is short for Enhanced vMotion Compatibility. EVC allows you to migrate virtual machines between different generations of CPUs. with EVC you can mix older and newer server generations in the same cluster and be able to migrate virtual machines with vMotion between these hosts. This makes adding new hardware into your existing infrastructure easier and helps extend the value of your existing hosts.
ESXi 6.0 supports these EVC modes:
- AMD Opteron Generation 1 (Rev. E)
- AMD Opteron Generation 2 (Rev. F)
- AMD Opteron Generation 3 (Greyhound)
- AMD Opteron Generation 3 (no 3Dnow!) (Greyhound)
- AMD Opteron Generation 4 (Bulldozer)
- AMD Opteron “Piledriver” Generation
- Intel “Merom” Generation (Intel Xeon Core 2)
- Intel “Penryn” Generation (Intel Xeon 45nm Core2)
- Intel “Nehalem” Generation (Intel Xeon Core i7)
- Intel “Westmere” Generation (Intel Xeon 32nm Core i7)
- Intel “Sandy Bridge” Generation
- Intel “Ivy Bridge” Generation
- Intel “Haswell” Generation
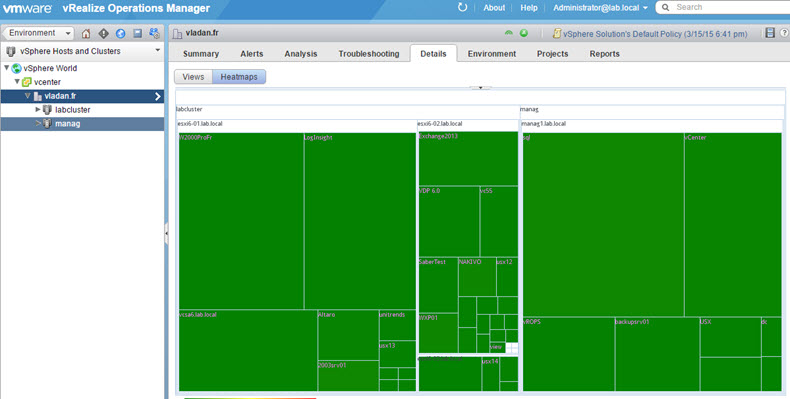
Troubleshoot virtual machine performance via vRealize Operations
vROPs is a separate vSphere product and needs really deep understanding on what's going on. I think that there should be a separate chapter on the blueprint if required for the exam….
The architecture has changed as well (there is no more UI VM and Analytics VM like int he vCOPS 5.8). The appliance works in cluster, and from within the dashboard you’ll be able to deploy/add an additional appliance (node) to the system to scale out. The solution is highly resilient, by using Gemfire to spread the data across at least 2 nodes. Two slices has the copy of the data (at least). If there is a failure of one of the slices, then another slice takes over.
vRealize Operation Management Suite 6.0 – New and improved features
- Increased Scale of a single deployment
- Cluster – shared data and UI
- Resiliency (application RAID!)
- Smart alerts with problem-definitions
- Customizable Dashboards and Reports (drag and drop to create new)
- Advanced capacity modeling via possibility to save capacity project and do a what-if analyse.
- Public APIs released to partners in order to work on additional extensibilities.
Newly the product will feature a management pack integration (add-ons) which will be delivered by VMware and partners for specific storage devices. There is 40-50 management packs available on the VMware Solution Exchange and those management packs can be installed inside the vRealize Management Operation. (vROPS)
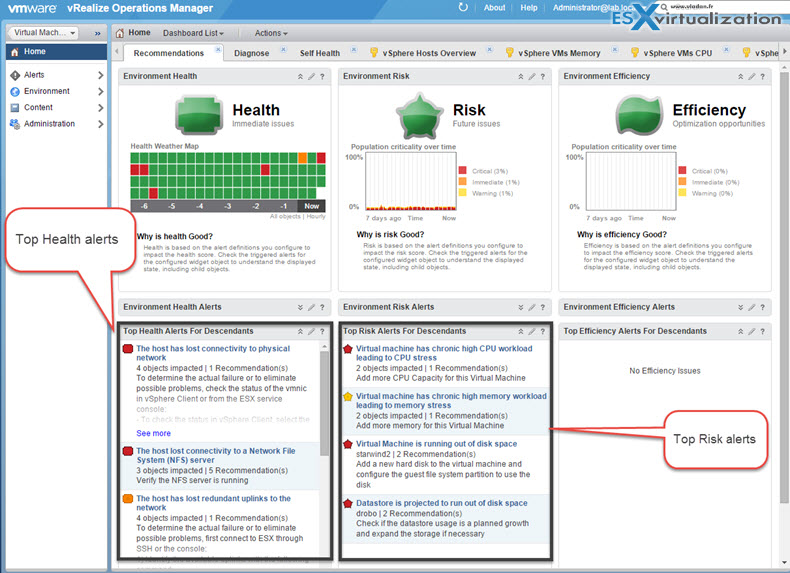
From the overview dashboard you can see which problems arise or will arise (in the Risk alerts section). By clicking the link you can drill down to see the problem.
Compare and contrast Overview and Advanced Charts
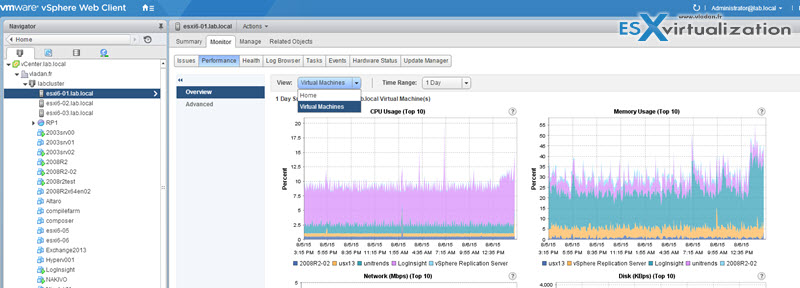
Overview charts
vSphere Performance guide p14.
display multiple data sets in one panel to easily evaluate different resource statistics, display thumbnail charts for child objects, and display charts for a parent and a child object. Advanced charts display more information than overview charts, are configurable, and can be printed or exported.
Overview chart from my lab. Select Host > Monitor TAB > Performance > Drop down chose between Home or Virtual Machines.
Advanced Chars
Select Host > Monitor TAB > Performance > Click Advanced
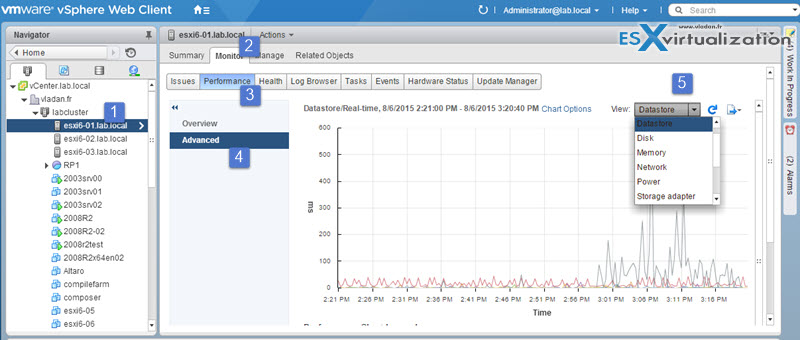
- More information. Hover over a data point in a chart and details about that specific data point are displayed.
- Customizable charts. Change chart settings. Save custom settings to create your own charts.
- Export to spreadsheet.
- Save to image file or spreadsheet

Tools
-
- vSphere Resource Management Guide
- vSphere Troubleshooting Guide
- vSphere Monitoring and Performance Guide
- vCenter Operations Manager Getting Started Guide (vSphere UI)
- vSphere Client / vSphere Web Client
Hi Vladan,
Thanks for this article! I want to optimize my supervision. I want to monitor the SWW/s and SWR/s values.
Regarding to you, what is the during time where we can encountering slowness in VM if this value are different from 0?
Imagine, if SWW/S is different from 0 during 1 seconde; I guess no impact on the VM, but I guess during 1 minute we will feel some slowness on the VM, right?
Regards