Xangati's recent product enhancements plus full detail product features.
Xangati has recently announced a new version of the Xangati Management Dashboard (XMD) Suite which consist of the VI Dashboard and VDI Dashboard. Both products are fully compatible for VMware vSphere 5 and Xangati has been demoing both products during recent VMworld 2011 at Las Vegas. Xangati offers free version which is limited to monitoring single ESX host, but otherwise there are no other limitations. Xangati's free products are very popular and it's no wonder that Xangati for vSphere was one of the Top 10 Free products on the session presented by David Davis and Kendrick Coleman – CIM1940 – 10 Best Free Tools for VMware vSphere Management in 2011. Also for the quality of the product Xangati Suite which won a Finalist Award at VMworld 2011 Las Vegas.
Xangati's unique DVR like recording capability, on which I reported last year, is an unique feature which permit to record what's happening automatically to replay at later time.
Now let's move on with the review of the product. The Xangati VI/VDI Dashboard appliances comes in the OVF format (it's actually zipped for the download), which is today's standard for fast and easy deployments through the vSphere client. So by going to the file menu and choosing File > Deploy OVF template you quickly deploy the VI Dashboard. The appliance is pre-configured with 4 NIC cards.
After the deployment of the appliance, start up the VM and you're ready to do the network setup. The network setup takes just a few minutes, and the only thing which one must setup is a port group for the Xangati Virtual Appliance and this port group must be configured in promiscuous mode. You must setup this promiscuous mode on every host you want to monitor.
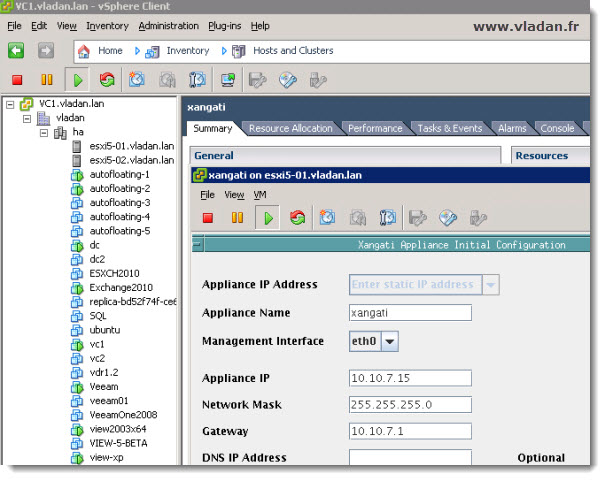
There is a nice video done by Nathanael Iversen from Xangati on how to do just that. Xangati eth0 should be mapped to the VM Network, or whatever port group you use for management traffic. Xangati eth1 will ultimately be mapped to a promiscuous mode port group.
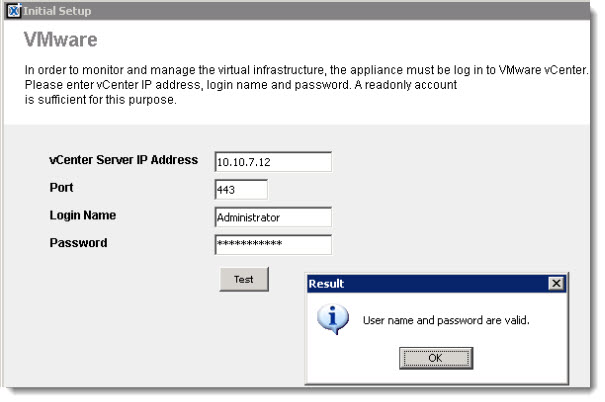
After you have setup the promiscuous mode, you'll have to do an initial network setup for the appliance. This is done when you open a console with the VM and login directly at the console. The default login/password combination is xanuser/use.xangati. Then when the initial GUI launches, use admin/admin as a login/password combination. You'll have to accept Java messages several times during the setup.
Xangati is focused on networking but with this latest VI Dasboard there are also some storage metrics too. One can see the latency across datastores and IOPs, and also different paths to a datastores from a host so there is a possibility to track down a switch path problems.
A WMI integration was introduced as well. After seting up the default Login/password credentials in the Options > Default WMI login, the WMI informations can be retrieved from specified VM. You can drill down and see the actual processes on a VM which are using resources.
On the screen below you can see the second part of the setup where you actually log In:
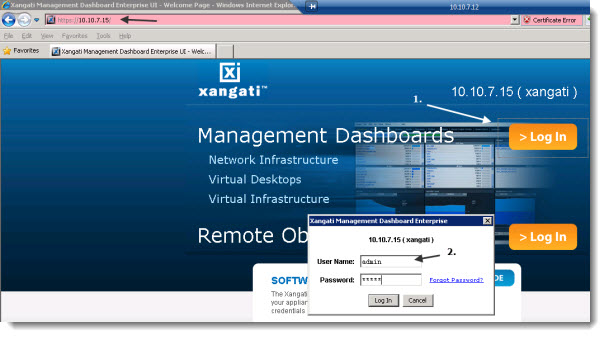
Once you finished the setup of the appliance, you have a possibility to launch 3 pre-configured dashboards. VDI Interface, VI Interface, and Standard Xangati. Each one of those you'll have to login differently:
01. vdiadmin/vdiadmin
02. viadmin/viadmin
03. admin/admin
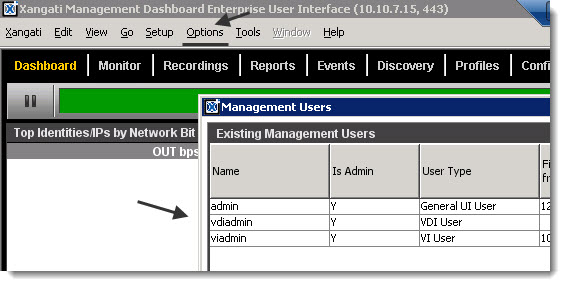
Hint: You can see this pre-configured logins in the Options > Management Users menu.
The newly introduced health engine This health engine helps establish the health index in VDI and VI dashboards. A performance profile is created from different metrics analyzed through the time. This profile is compared then to real time values. If there is a difference between those 2 values, then there is an alert and the VDR recording is automatically triggered. During the recording the problem object is captured and the set of interactions that were there.
Xangati Suite learns about the environment the first day in order to implement the health engine. In fact we can see the immediate results if the environment is small enough, and then the profile gets more and more precise over time when the timeline gets longer and the appliance can “compare” the real values to values historically stored in the internal database.
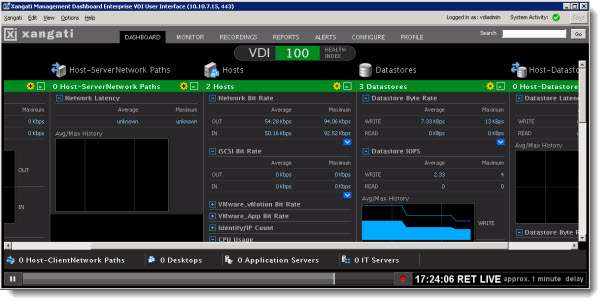
The DVR-like recording capabilities, which has been present in the product since the beginning, has the possibility to start recording when the performance degrades suddenly. The recording starts automatically and gets saved for later viewings. But what's interesting that you can hook any vCenter alarm to send an SNMP trap to Xangati and Xangati starts the recording when a vCenter alarm gets triggered. The setup of this is fairly easy.
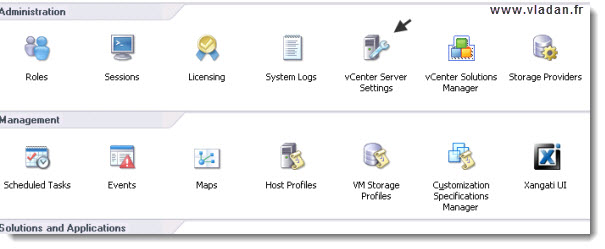
Go to your vSphere Client and click vCenter Server Settings icon.
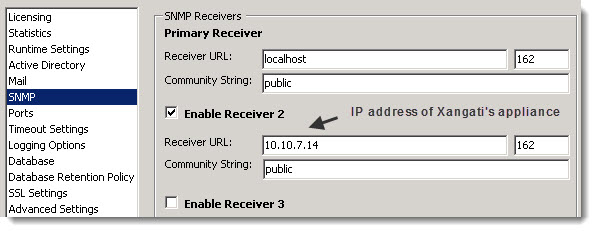
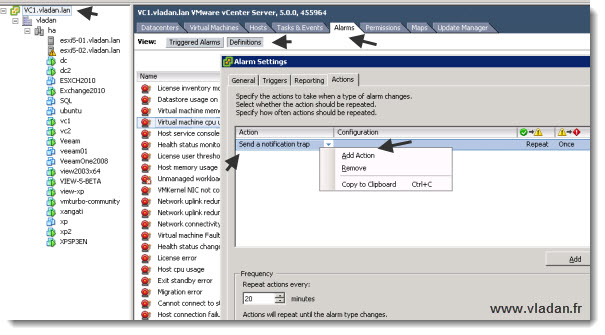
Once done, validate and close. Then you can select your Datacenter > click and select Alarms TAB.
Right click inside the blank area and choose Add Action > from the drop down list choose Send a notification trap.
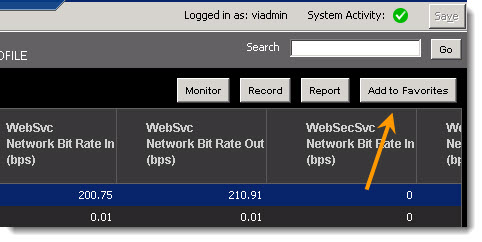
Add To Favorites – Now the appliance setup, you can start exploring the interface and start using it. One of the first think I wanted to configure, was the favorite button. In fact once you double-click a VM for example you open a detailed view which shows you the flow and interaction of that VM with other VMs or other active elements (ESX hosts, routers, switches etc.). You can click the favorite button to save that view, cause if you don't and you close your view, you'll need to drill down to your element once again. This favorite feature is pretty handy.
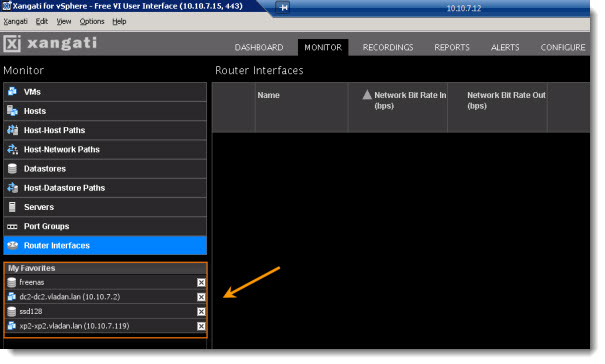
And here you can see where you'll find all your favorite views…
Search Box – A very powerful feature which is helpful when searching for your elements or protocols to monitor within your infrastructure. The search box is located on the right top side of the classic Xangati dashboard. Note that when you just type the few first letters, you'll get already some suggestions….
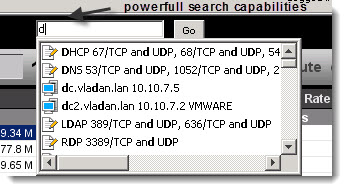 Whether you're looking to monitor a protocol or an entity, you can use that search box to drill down for an activity.
This feature is present in both dashboards, the classic dashboard (with the login as admin), and also in the VDI dashboard (with the login as viadmin).
The possibilities are endless here.
You can also monitor traffic between 2 machines. Do a right click on one entity and type IP address of the other entity into the search box. The result will be a view between those 2 objects and you'll be able to see the the traffic between those 2.
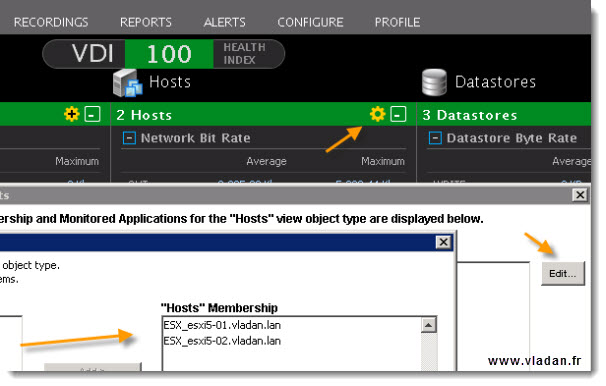
The VDI dashboard when first started, it waits to be configured. You can configure it by choosing the right elements which are important for you. It’s up to you to choose the right elements, the elements that are important for you to keep an eye on it, and create your own view of your infrastructure. It's fairly easy, just click on the yellow circle icon and add your entities for that view.
Remote Object Viewer – With this feature you can provide Smaller Dashboards for coworkers or contractual IT staff to monitor just their servers. You can have for example a person who is in charge of working on single VM or physical server. Or you have a contractor or external firm which needs to monitor their application. Without showing them all your infrastructure you can provide them with this simplified view.
You're able to provide a simplified dashboard which connects to XMD and pulls the information from there. I'll show you in few steps how to do it…
Select the Viewer Users Menu > Add new user there.
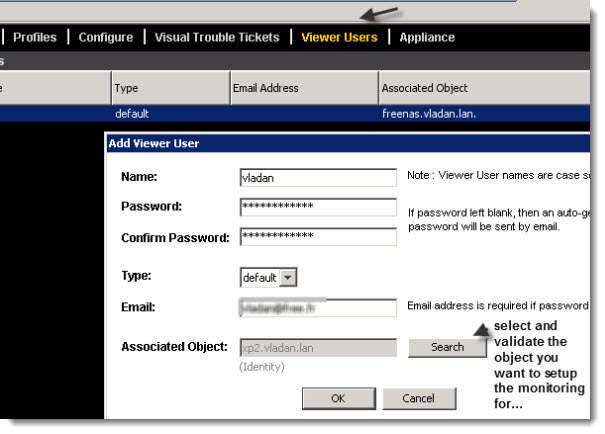
Save and Validate the setup. Then Go and fire up your web browser interface and type in the IP address of you Xangati virtual appliance. Click the second from the top button – Remote Object Viewer
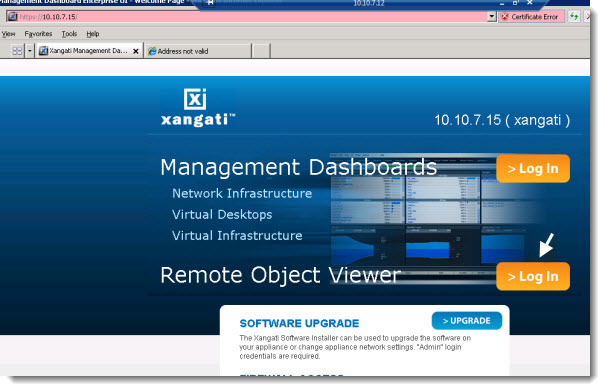
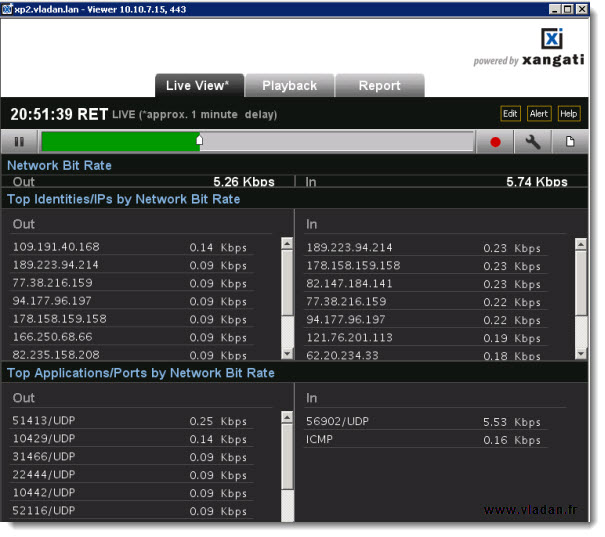
You'll see a small windows prompt which will logs you in for finally get a very simplified dashboard, but with all the features present like in the full XMD.
In my case I did the test and connected myself to a simple VM with Windows XP as an OS….. See the screenshot below.
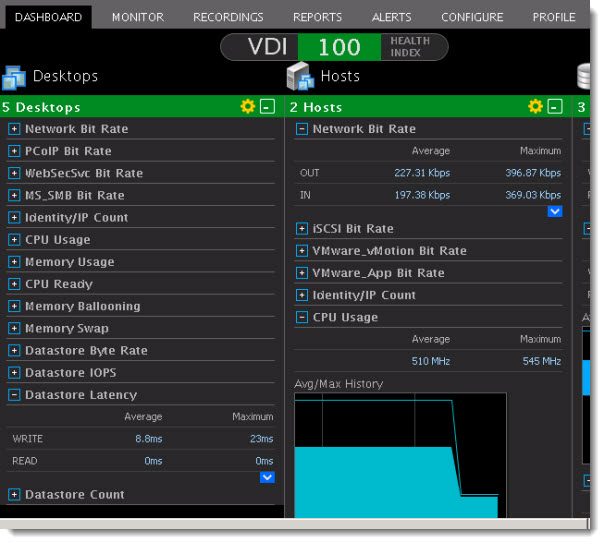
The VDI sessions can be fully monitored by selecting the PCoIP protocol and adding your VDI destops to the right place on the Xangati VDI dashboard.
On the image below you can see the VDI dasboard configured in my lab.
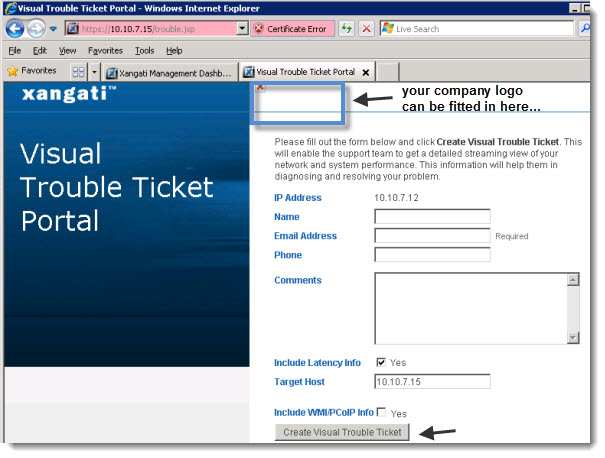
Visual Trouble Tickets – The product presents one a very useful feature for the end user. Give the possibility to record the activity by using the DVR recording capabilities and send a notification to the admin of what’s happening at his side. The feature can be integrated with existing service desk solution software solutions like remedy for example.
Grouping personalized reporting – one more feature I'd like to mention is the creation of personalized reports which is present within the product. With personalized reports you can create personalized reports where you can group elements of your choice. In my case I just grouped 2 VMs together – a Domain Controller and Exchange 2010 Server – for testing purposes.
Now how it's done:
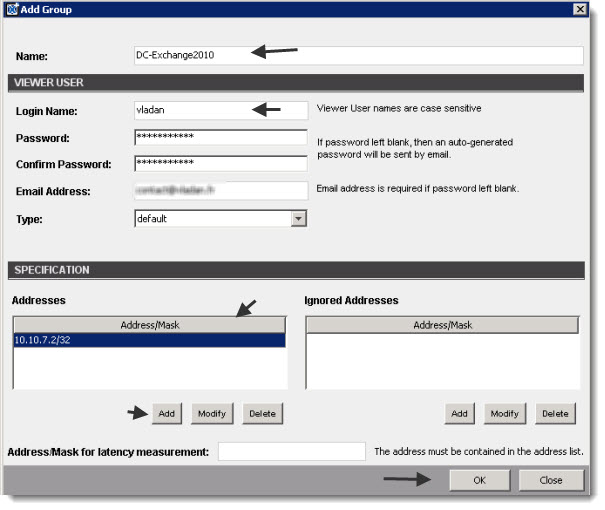
First go to the Configure Menu and choose Add Group.

This bring up a window where you can enter the name of the group and the login used.
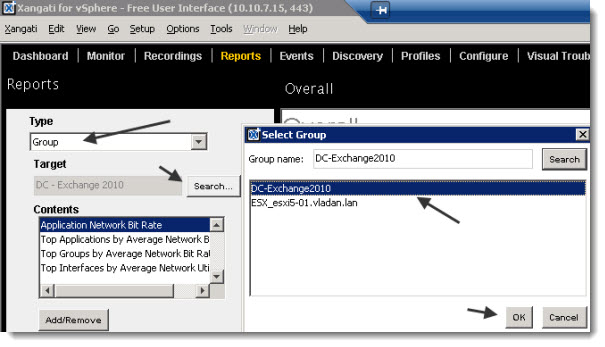
Validate through the OK button and go back to the menu, where you'll choose the Reports. From the Drop down choose Group and click on the Target button to choose the group you just created.
Hit the View button to see your report. You have the possibility to send the report by e-mail as well, in case you previously configured the e-mail address…
Xangati's unique capability of real time monitoring coupled with DVR like automatic recordings are unique features available on the market today. No one else does this (as far as I know). So the product has it's unique possibilities delivered to IT administrators the easiest way out of the box with 2 different dashboards pre-configured or with an easy-to-do configuration. The possibility to test the product on one ESX(i) server for free during unlimited time gives a good possibility for the product to be adopted in the enterprise, since usually 15, 30 or even 60 days trials don't let you enough time to study in deep a product that you would like to roll in your Datacenter.
Please note that this review was sponsored by Xangati.
