
Today we have an interesting post detailing Paessler's PRTG monitoring capabilities for VMware vSphere and ESXi environments. We'll look at the specific needs of VMware admins and see the Paessler's sensors. What they monitor and how they might be making difference when it comes to monitoring virtualized infrastructures. The software does monitor much more than only VMware environments, but in this post, we'll focus only on that particular one.
Let's first recap what Paessler does for readers who do not know this German company. I've met with Paessler on last year's VMworld Europe in Barcelona and they told me that their free offer has a lot to offer. You can try the product during 30 days and during this time you can use an unlimited number of sensors. After this period you can keep 100 sensors for free.
Paessler's flagship product is called PRTG Monitor which after download and installation, will auto-scan your network to discover all your connected devices. It means that it discovers your IP network, switches, firewalls, printers, VMware ESXi hosts, VMware vCenter servers, Hyper-V hosts, individual VMs or other dedicated Windows or Linux systems. And it does it with rapidity and ease.
PRTG does not need any agents to be installed on ESXi, vCenter, Hyper-V or your VMs. You can use agents, however, for environments which are separated by a firewall. Those agents are called Remote probes, allow you to monitor different sub-networks that are separated by a firewall from your PRTG Software.
VMware and IT admins need to get informed about any anomalies, about any errors, slowdowns, within IT infrastructures. Having a single monitoring system which can monitor physical, virtual, and network infrastructure from a single pane of glass is usually the option every admin is looking for.
Quote:
Monitor all systems, devices, traffic and applications of your IT infrastructure. Everything you need is contained in PRTG, no additional downloads are required.
Before PRTG can do that, you must enter some credentials and logins/passwords. It means that whether you want PRTG to discover all computers and VMs within your Microsoft domain, you must enter the domain credentials. Whether you want to configure monitoring of your SQL servers, you must enter the SQL authentication (if they are configured this way).
PRTG uses sensors
The way that Paessler's software works are that it uses what's called sensors. Each individual sensor is different and monitors something different. There are sensors for Windows Server systems or sensors which monitors ESXi hosts.
For VMware monitoring, it uses WBEM which stands for Web-Based Enterprise Management (WBEM) protocol.
The Common Information Model (CIM) interface on an ESXi host provides a way of remotely monitoring the hardware health of your hosts via the Web-Based Enterprise Management (WBEM) protocol.
Below is a screenshot from the lab, a sensor for VMware ESXi Monitoring.
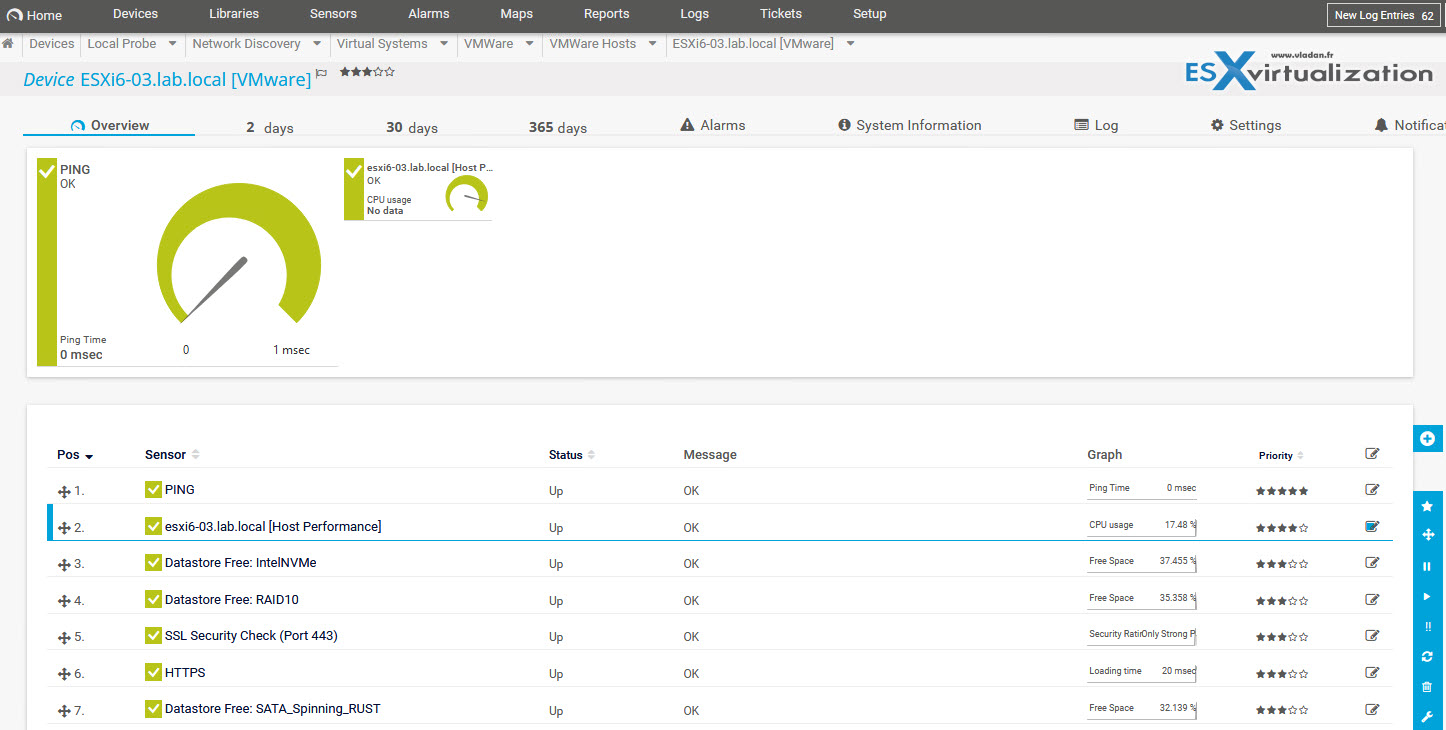
The lab has some VMware ESXi 6.7 running, managed by VMware vCenter Server Appliance (VCSA) 6.7. Whether it is not yet officially supported by PRTG, the software discovered the ESXi and vCSA environment without any problems.
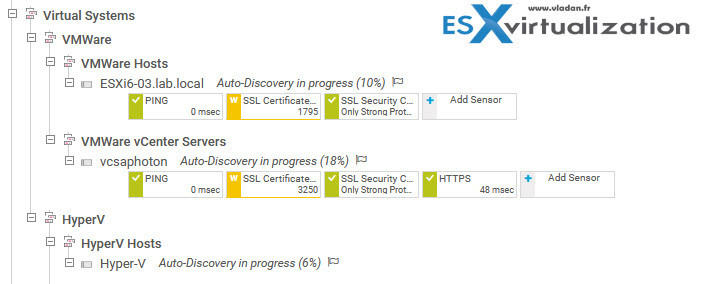
All I needed to do is to enter the credentials. During the detection phase, which lasts a couple of minutes (depending on the number of ESXi you're running in your environment) and also other network and server devices, PRTG works in a background. So you can either continue its configuration or just sit back and relax.
Screenshot from the lab where PRTG is discovering one of my ESXi and vCenter Server Appliance (vCSA).
And here is another screenshot showing the discovery phase has finished. If there is a just small number of sensors within one device, you can see one (or) two range displayed. But when there is like 34 sensors, there are grouped together.
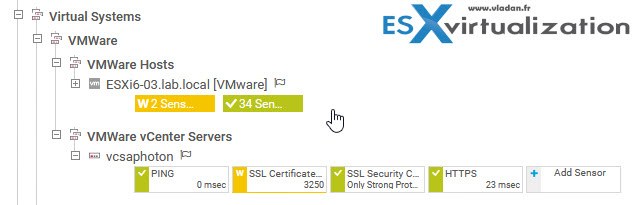
Once you click the group, it takes you to a new page. Oh btw, I haven't mentioned that you don't need any browser plugin or any other software to download. It's purely HTML and it's fast. It uses Ajax-based web interface.
Through the UI you can configure devices and sensors, to set up notifications, and also you check and review monitoring results. You have also a possibility to create reports. This web interface is interactive and uses Asynchronous JavaScript and XML (AJAX).
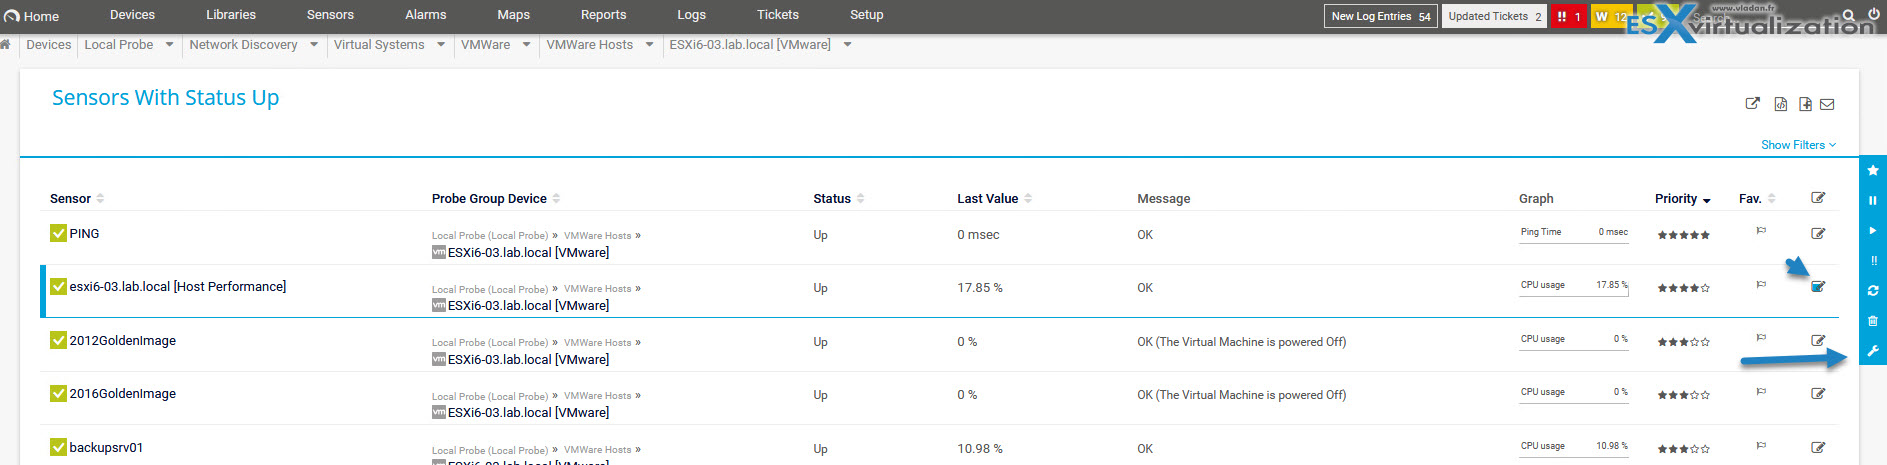
So once you are on the second page you'll see all those sensors and you have some possibilities of configuration and change. You can also delete sensors you don't want to include…
Depending on your hardware manufacturer or ESXi version, you might need to go and enter some command line interface (CLI) commands in order to activate the remote management. From ESXi 6.5 onwards, VMware introduced a new namespace named as ‘wbem’ as an extension for esxcli which controls the services such as sfcbd and wsman.
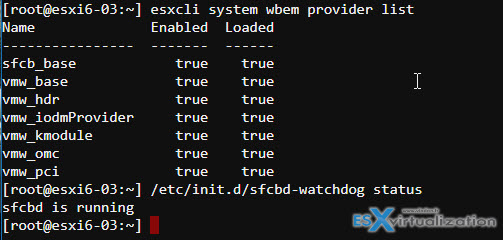
From ESXi 6.5 and higher, sfcdb and wsman are disabled by default as wbem is kept to false by default, but you can you can quickly enable it with those commands after enabling SSH access:
/etc/init.d/sfcbd-watchdog status
or
/etc/init.d/wsman status
Here is the output from the lab.
If any of those services aren't running you simply type:
esxcli system wbem set -e 1
And it's easy to get help in case you're lost. Simply type this:
esxcli system wbem set -h
The detailed post about the config of wbem in VMware ESXi can be found here.
Wrap Up:
As you can see, the config is pretty simple and 100 sensors you can use for free. Whether you have a small lab or you are using cloud services, such as Amazon, Azure or Oracle/Ravello, Paesler's PRTG Monitor can quickly point out to part of your infrastructure which are having problems or simply bring good overview and details of the overall health. There is a possibility to create custom dashboards, which is definietely a must to adapt the software to show you what you care of most.
We haven't entered much into details due to the fact that it would need much longer and detailed write up, but who knows, perhaps in the future, we will focus more on this interesting piece of software.
Note: This post has been sponsored by Paessler.
PRTG monitor can show the following, depending on the selected ESXi component:
- Health status
- Temperature
- Power
- Fan rotations per minute (RPM)
- Battery voltage
PRTG can be installed in other languages, such as French, German, Japanese, Portuguese, Russian, Simplified Chinese or Spanish.
Links:
Downloads: Freeware and Free Trial versions of all products can be downloaded from here. The trial will transform itself into free edition after 30 days.
More from ESX Virtualization
- How VMware HA Works?
- VMworld 2018
- Free Tools
- Install and Configure VMware vCSA 6.7
- VCP6.5-DCV Objective 2 – Secure ESXi and vCenter Server
- Win an all-expenses-paid trip to VMworld US or Europe
Stay tuned through RSS, and social media channels (Twitter, FB, YouTube)
Hi,
PRTG 17.X does not work with ESXi 6.7 ..
All WBEM services are ok and we have no problem with ESXi 6 servers
But on ESXi 6.7 Servers it says :
Error establishing secure connection (TLSv1+: Socket Error # 10061 Connection refused. — TLSv1_0: Socket Error # 10061 Connection refused. — SSLv3: Socket Error # 10061 Connection refused. — SSLv2: Socket Error # 10061 Connection refused.)
Please check the following resources:
The parent device must be a VMware ESXi server version 5.0, 5.1, 5.5, or 6.0.
TLS V1 is disable by default inside vsphere 6.7 you need to re enable it, but your vsphere will become less secure…
by default 6.7 run only tls 1.2