
Opvizor Performance Analyzer is a performance monitoring product for VMware vSphere environments. Performance analyzer can monitor vSphere environment as a whole, starting with core infrastructure (ESXi, vSphere) to finish with VMs.
When firefighting bad performance of an environment, you need to see an overall picture first, then go deeper and find the root cause. Many tools on the market are available and one of them is Opvizor Performance Analyzer, which just recently has added a new Starter Troubleshooting Dashboards to the already large list of features the product can do. The product has already a 4.6.2 release number and new features are added quickly.
In this post, we'll have a look at Starter troubleshooting dashboards, but also talk about some upcoming features. Performance analyzer is bundled as a virtual appliance which is deployed a standard way to any VMware vSphere environment. The welcome e-mail has the necessary steps to get you started.
Starter Troubleshooting dashboards are two:
- VMware Virtual Machines
- VMware ESXi Host Troubleshooting
After deployment, you'll find many pre-defined dashboards which can be used out of the box, but the two new dashboards we'll be talking about today has to be imported. The import is pretty simple as it's just a .json configuration file which needs to be imported. We'll show you quickly how to import a new dashboard via .json file.
Opvizor Performance Analyzer – How to import a new dashboard?
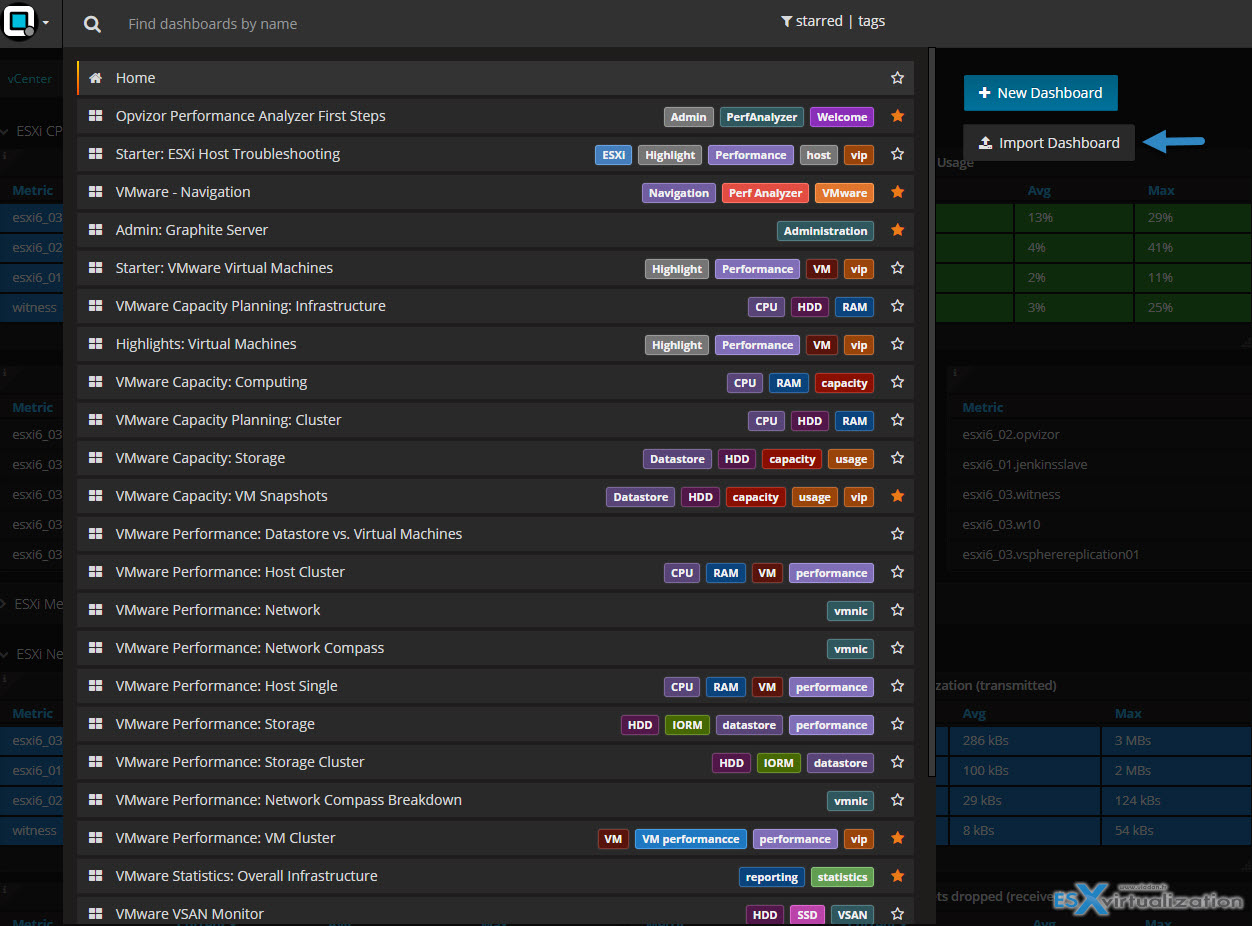
Very simple when you click inside of the search field, you have those pre-defined dashboards showing up. On the right-hand side click the Import Dashboard button.
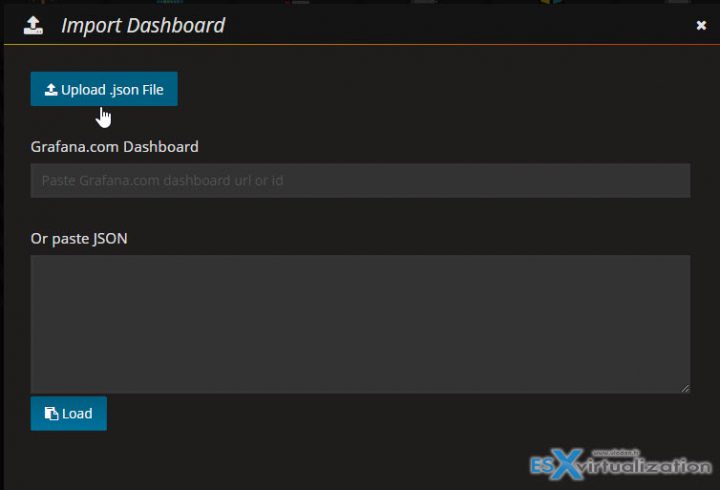
On the overlay window, click Upload .json file to load the new dashboard and its configuration.
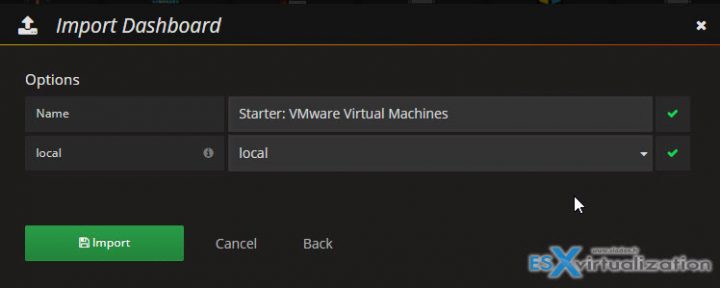
Then select the .JSON file you have previously downloaded from Opvizor'd website, from the drop-down select local, and click the Import button.
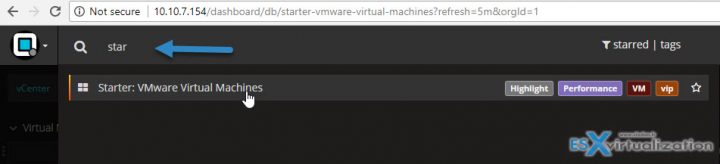
That's it.
Then simply start typing “star” into the search field, to show this dashboard.
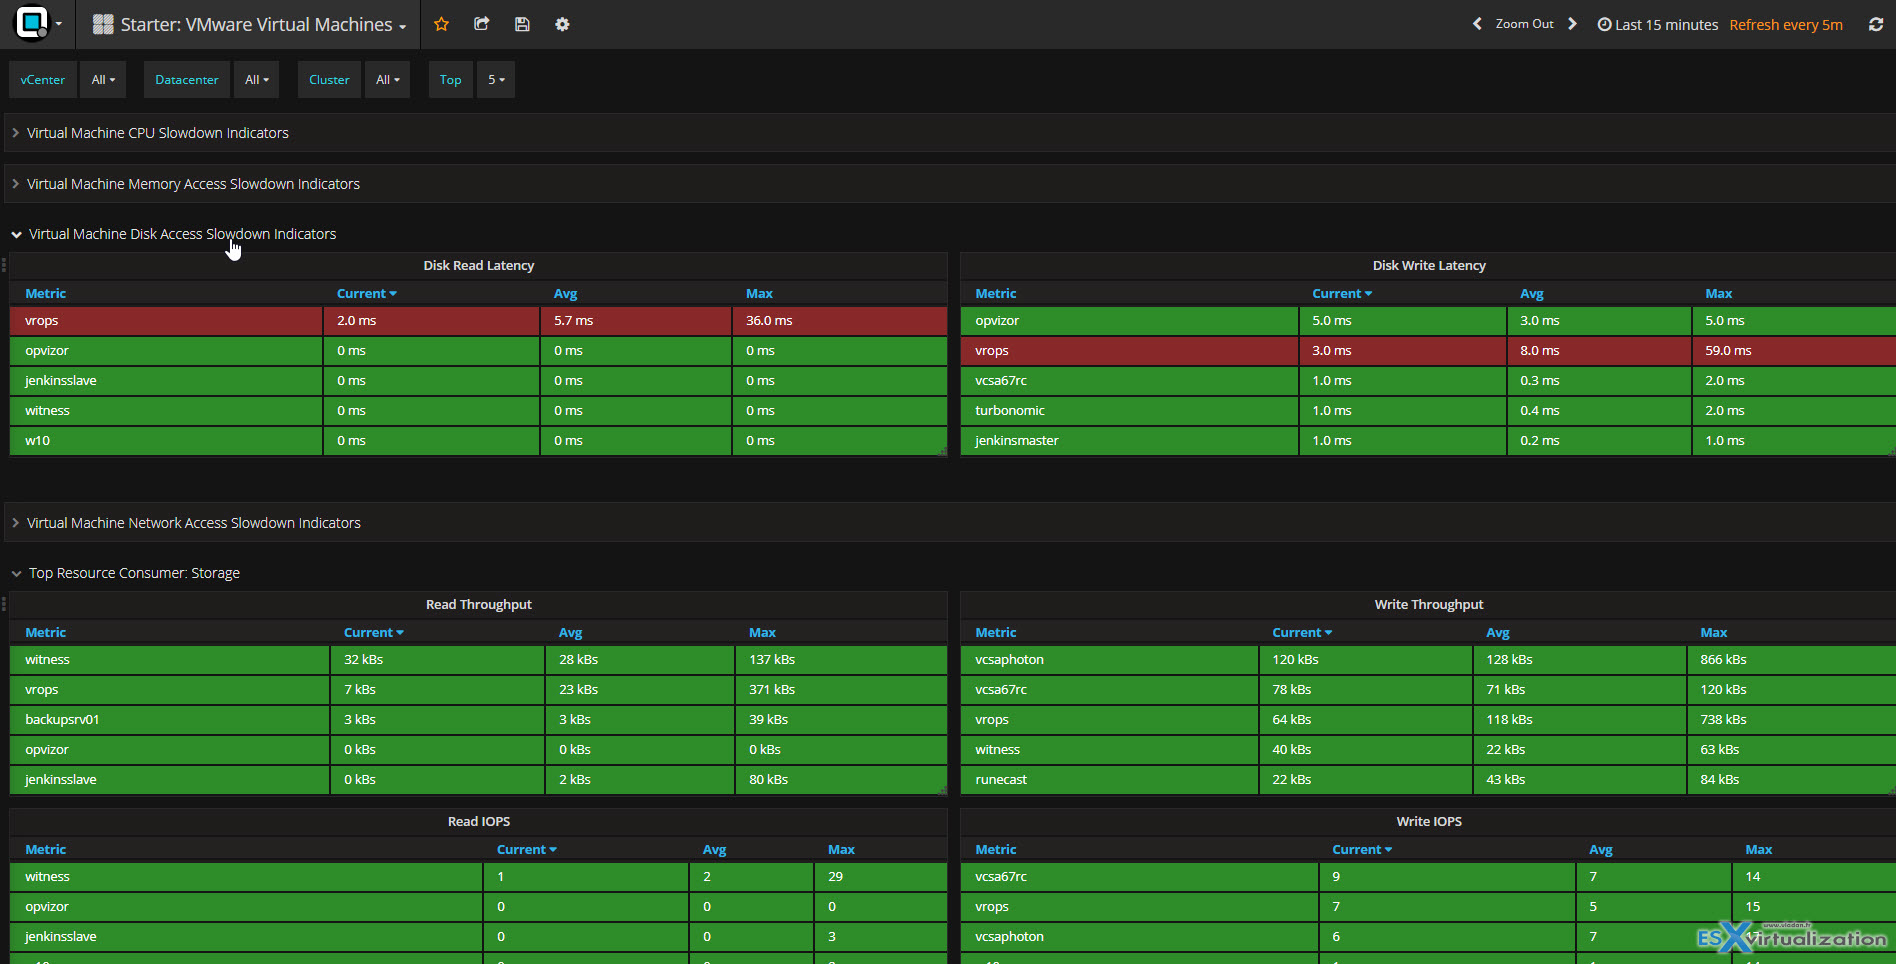
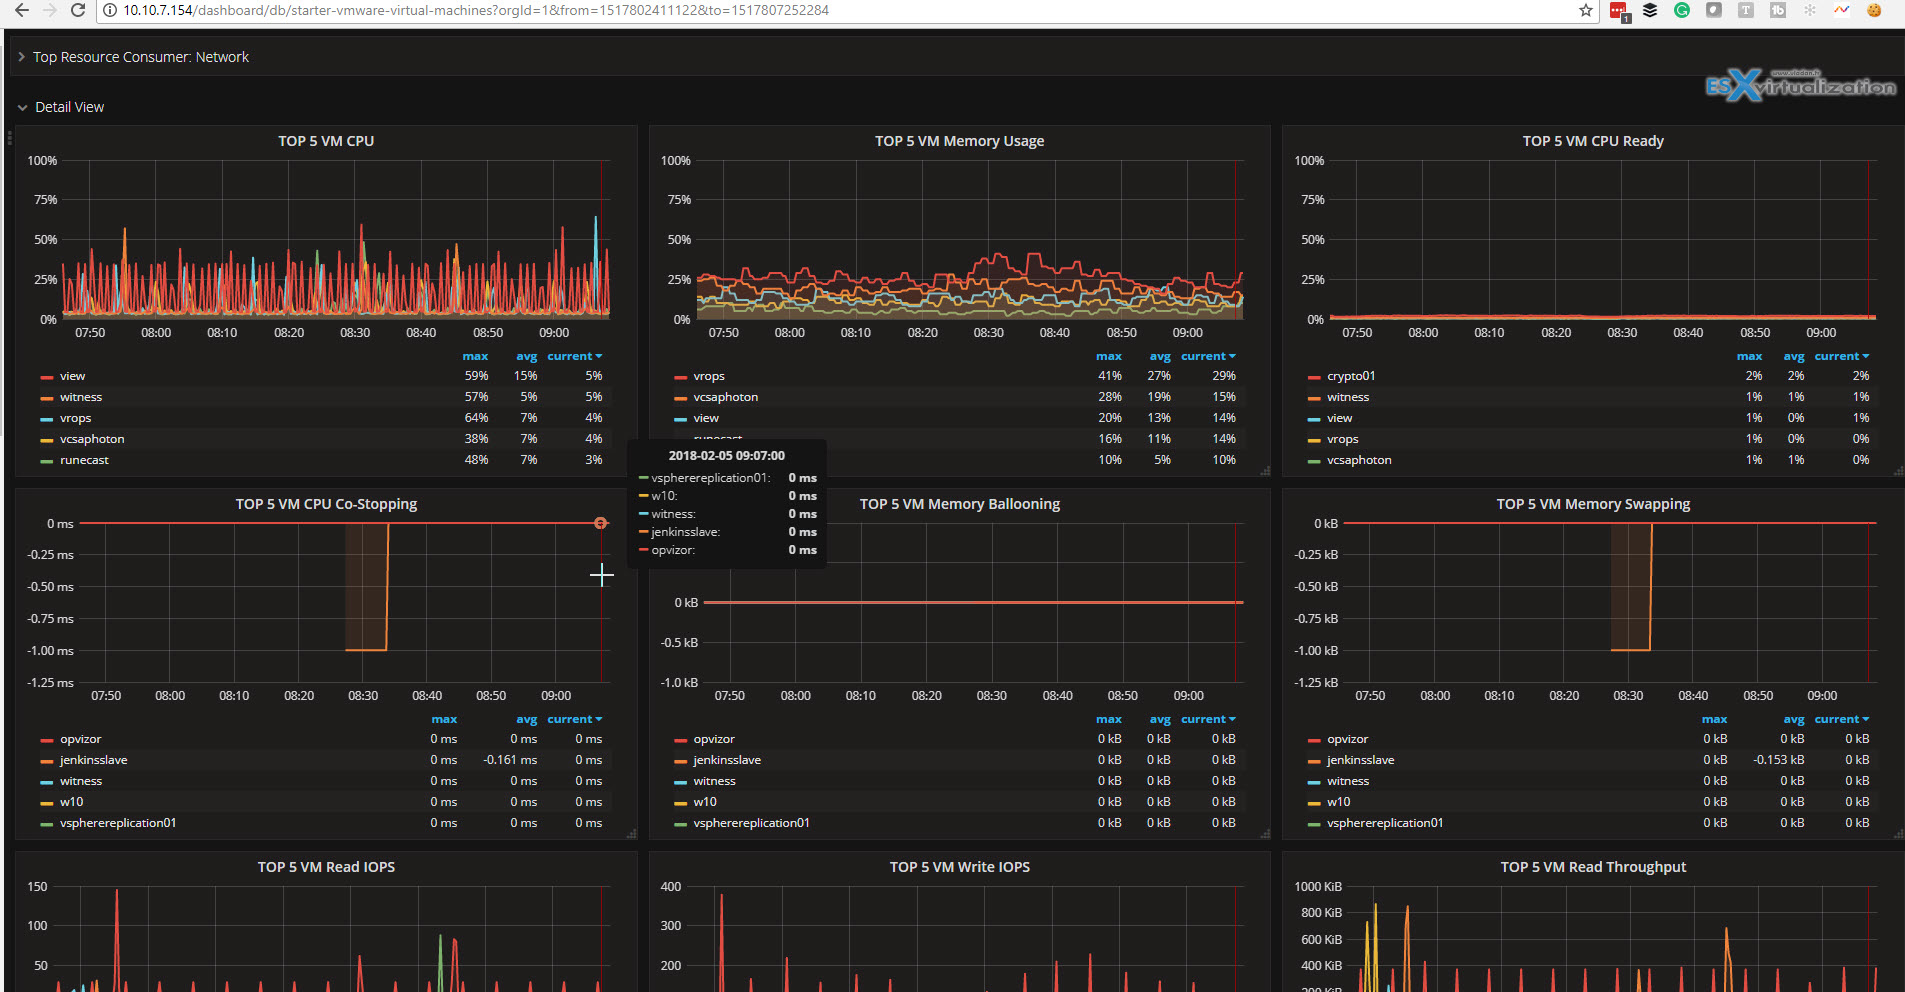
The Starter VM Troubleshooting Dashboard has some basic metrics which shows in the dashboard:
- CPU Usage
- CPU Ready %
- CPU Co-Stopping
- Memory Usage
- Memory Ballooning
- Memory Swapping
- Disk Read Latency
- Disk Write Latency
- Network dropped incoming (RX) packets
- Network dropped outgoing (TX) packets
- VM Storage Read Throughput
- VM Storage Write Throughput
- Read IOps
- Write IOps
- Network vNIC throughput incoming (RX)
- Network vNIC throughput outgoing (RX)
- current, average and maximum values for the chosen timeframe
- go back up to months, years (depends on configuration)
The Starter Virtual Machines dashboard is divided into sections where each section lists 5 VMs (configurable) which are sorted by performance metrics. You can collapse or expand each section with a click of the mouse. Sections are based on usual indicators such as cpu, memory, network and disk access. There is also write and read IOPS indicators, for those willing to see the storage performance of their VMs.
Here is a detailed view of the Starter VMware Virtual Machines dashboard… You can click to get a high-res image in an overlay.
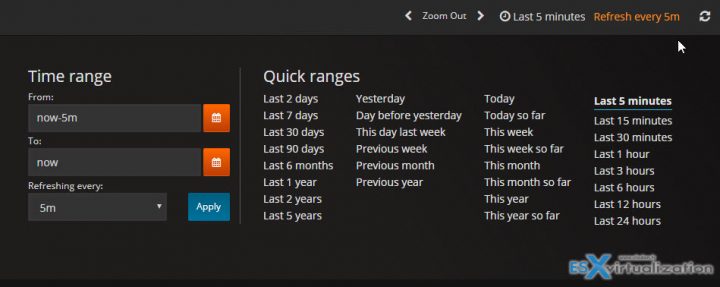
You can choose the time since when you want to show the data on the screen. There is a choice to show historical data from 5 min as far as 5 years of time… Those are accessible from the right-top of the tool. As you can see there are many quick links where you simply click, but you also have a choice to select your proper time range whether you monitoring a specific time period.
The product is easy to navigate and to work with. You can be up and running in 5-10 min.
The detailed view bottom section shows further details when it comes to vCPU, Memory, CPU ready and many other detailed counters related to VMs.
There are many sections, many dashboards to talk about and too little space to list them all. The overall design is very nice indeed.
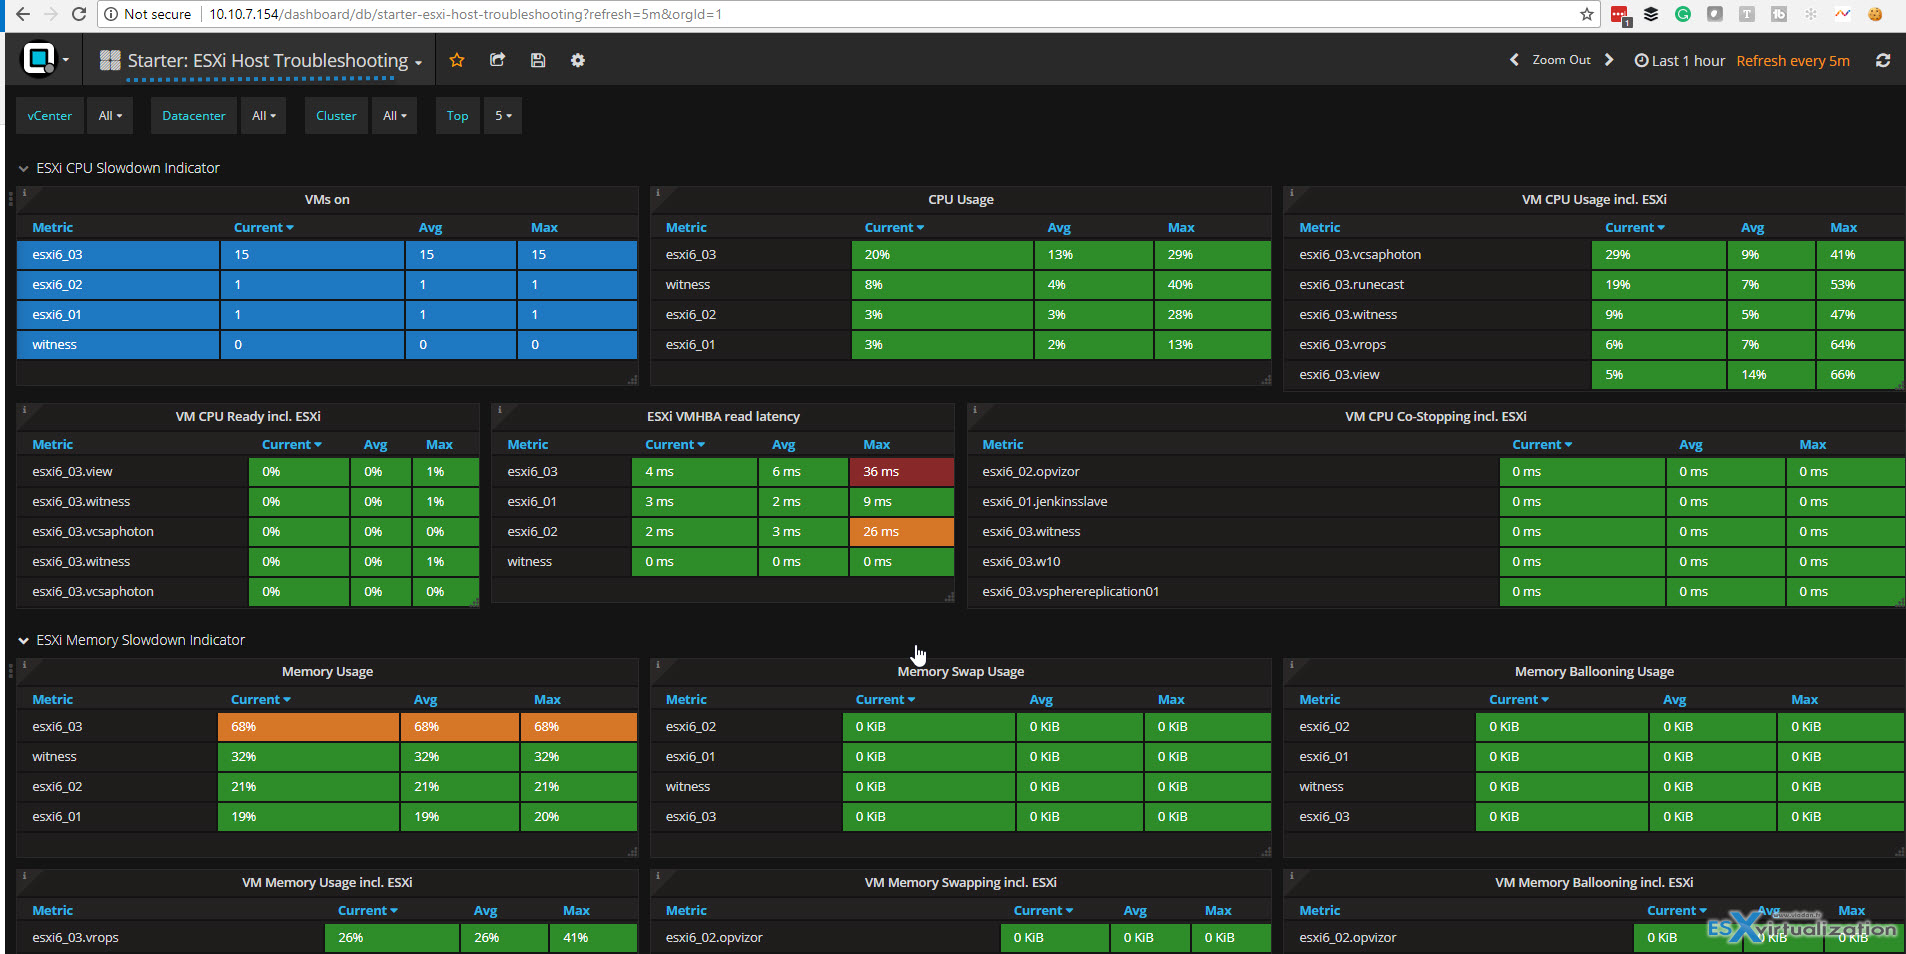
Starter VMware ESXi Host Troubleshooting Dashboard
This is the second starter dashboard which you can download as an “add-on”. Again, .json file to import, and the dashboard looks like this. All metrics related to individual ESXi hosts within the cluster shows up.
Again, the sections can be collapsed or dragged up higher/lower. We can see already some orange or red values from my environment showing possible problems.
Opvizor has also integration with other products and is able to pull data from many popular solutions:
- VMware vSphere
- VMware vCenter appliance (VCSA)
- Microsoft Hyper-V
- Amazon Web Services
- Microsoft Azure
- NetApp
- Docker
- Linux and Windows guest systems
- MS Windows processes and services
- Linux processes and services
- DataCore
- Microsoft SQL and other databases
- Veeam Enterprise Backup Manager
It seems that we haven't had a chance to “catch” this product's initial release and so we are reporting on it only now, but we were pretty impressed with the number of details which can be monitored and the number of useful metrics which are already in.
Outside of what we reported on, there is, for example, a possibility to monitor and track NUMA nodes and the virtual machine resources using them. Also monitor HBA adapters (latency, throughput, IOPS or “commands averaged”. VM kernel latency metrics can be pulled out showing VMkernel queue and the latency at the VMkernel level. And more.
We haven't talked about many of the existing features which make this product shine because this isn't possible in a single blog post. We were nicely surprised with the speed of the solution allowing you to work without any wait.
The product is fast to work with and has a great UI. Definitely made for large high-resolution screens, as you have a possibility to show more details without scrolling. The future releases shall bring more metrics related to vSphere. What we know that there will be some ESXTOP counters added. Stay tuned and once we know more, this post will be updated.
UPDATE: New Release of Opvizor 4.8 released
What's new?
Data Crawling
- crawling speed – multi-threading support improved (starting 4 vCPU and higher for large environments)
- ESXTOP integration, i. e. NUMA Home Node % and Bytes
- new metrics added (NUMA metrics, CPU Features, Microcode and ESXi Patchlevel)
- extensive support for renaming and movement of VMs, cluster or ESXi hosts (migration)
- avoid vCenter bug sending extremly high latency values
- support for NetApp ONTAP 9.3 and NetApp OCUM 7.3
- new OS collectors (Windows, Linux, MS SQL)
Dashboard
- new Intel bug Spectre/Meltdown dashboard including update progress and performance changes due to the patch
- new Starter Dashboards for VM and ESXi host troubleshooting
- new Highlight Dashboards for Linux and Windows OS
- added widget help for VMware dashboards
- small visualization bugs fixed
Other
- Admin interface changes: AD configuration, AD Group support for Administrator, Editor or Viewer roles
- logging enhancement
- /var/log directory moved to /data disk (2nd virtual disk of VM), that supports auto-resize
- new Grafana 4.6.3 engine
- new Heatmap plugin
- Out of memory detection (lack of resources)
- minor bugfixes and improvements
There is 30 days trial available allowing you to test the product during 30 days. Check it out.
Links:
- Opvizor Trial Download
- Online Help – manual.opvizor.com
- Download Starter Dashboards from this blog post at Opvizor.
More from ESX Virtualization
- VMware vSphere Client Download Page
- Configuration Maximums
- What is VMware vSphere Update Manager?
- What is VMware CPU Ready?
- VCP6.5-DCV Objective 2 – Secure ESXi and vCenter Server
Stay tuned through RSS, and social media channels (Twitter, FB, YouTube)