
SysKit is a server monitoring software that lets you track servers in real time and provide historical reports about the environment being monitored. The product is completely agentless, which allows fast deployment and easy maintenance as there is no need to update agents on monitored servers. All information is gathered using default APIs and/or WMI queries. ICA and RDP APIs from Citrix and Microsoft are used for the data retrievals.
SysKit is developed by a company called Acceleratio, which also created monitoring and reporting solutions such as SPDocKit, CloudKit 365, and SQLDocKit. Today, in this review, we'll focus only on SysKit, its installation and use cases.
SysKit supports monitoring of Windows Servers, SharePoint, SQL, Workstations, multiple RDS or Citrix farms, XenDesktop, and VMware Horizon View, all from a single console. You can track user activity, diagnose performance problems, monitor application usage, and more.
Some third-party applications for remote-delivery software, such as Parallel RAS, Thinspace, Systancia’s AppliDis Fusion, Ericom software, and Propalms, are supported as well. The product has support for multiple Active Directory (AD) domains, so different domains with a delegated trust can be used via one-way trust to the SysKit application.
The application can be installed either as normal software console or with web-based UI with an IIS web server to give you remote access via web browser and the possibility to display the reports on a big TV screen. As a database, it's possible to use the free, bundled SQL Express 2012. For larger installation depending on the daily data volume of the ingestion stream, you can opt for an external Microsoft SQL server. The SysKit web application, which is part of the installer, can be installed on the same server as the SysKit desktop application or on a separate server.
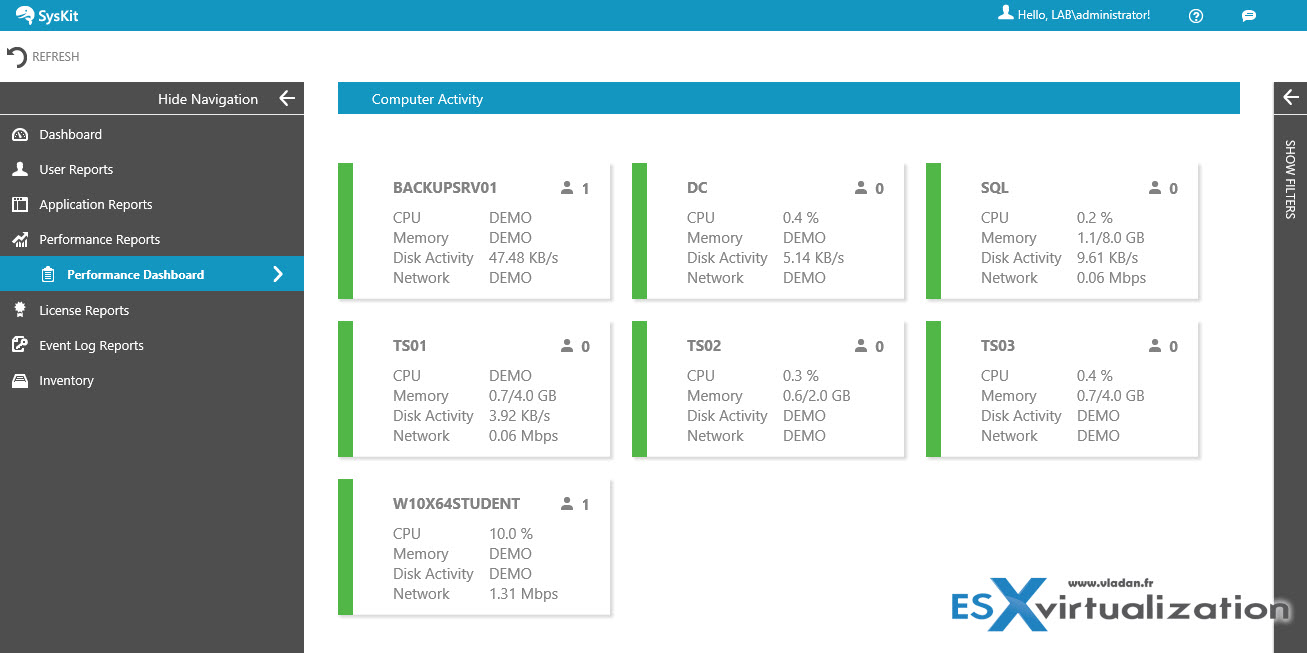
Overview of SysKit web based application.
SysKit Features
- Performance monitoring
- User activity tracking
- Application usage monitoring
- Server inventory in real time
- Security audit reporting
- Server roles monitoring
- Remote administration via PowerShell
- Access logs audit
SysKit System Requirements
- Windows Server 2008 to Windows 2016.
- Net Framework 4.5.2 (required only on the server where you will install and run SysKit).
- Microsoft SQL database – Free Microsoft SQL Express is supported and bundled.
- Administrator account part of local admins' security group on all the servers you'll be monitoring.
As you can see, SysKit is only for Windows platforms.
SysKit Installation
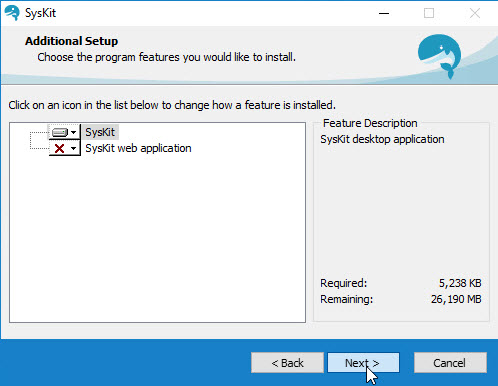
The software can be downloaded from the SysKit website as a 30-day free trial, giving you the option to test all its functions within this period. Once you launch the installer, you can install two components:
- SysKit desktop application
- Web application (for access via browser)
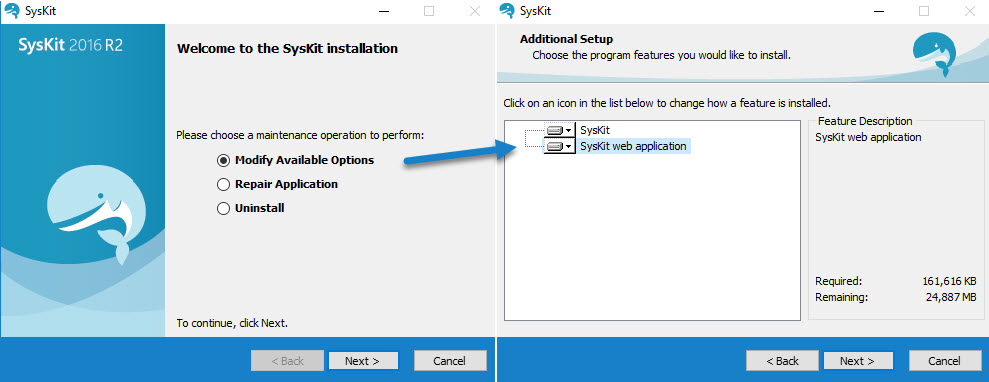
Let's say that at first, you want to install only the SysKit desktop application. You can still re-execute the installer later and put the web application on the same system. You can also install the web application on a different server.
To show the maintenance option, it looks like this. You can add/remove the web-based component at will. After installation, the system asks you to reboot the server. The configuration continues with the web-based part, and the process is straightforward.
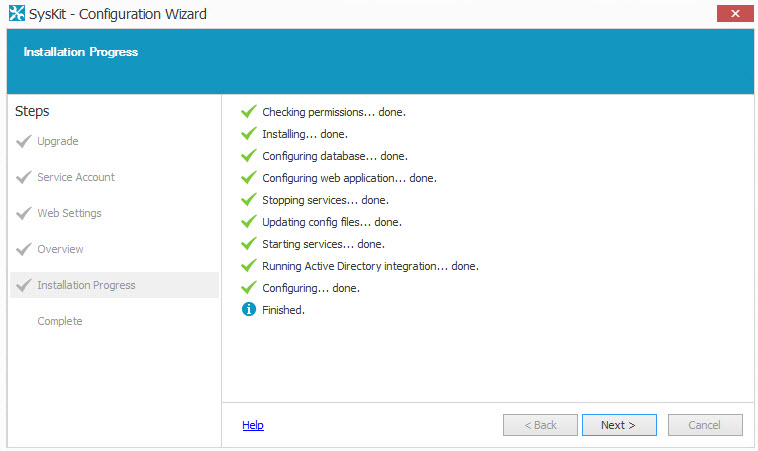
The final screen of the installer looks like this. All green checks.
Add your Servers
It’s pretty simple to add servers to the system and start monitoring them. From the main screen, select Administration > Select Computers > Add.
Then check the box to select all OUs or just the ones you would like to include within the selection.
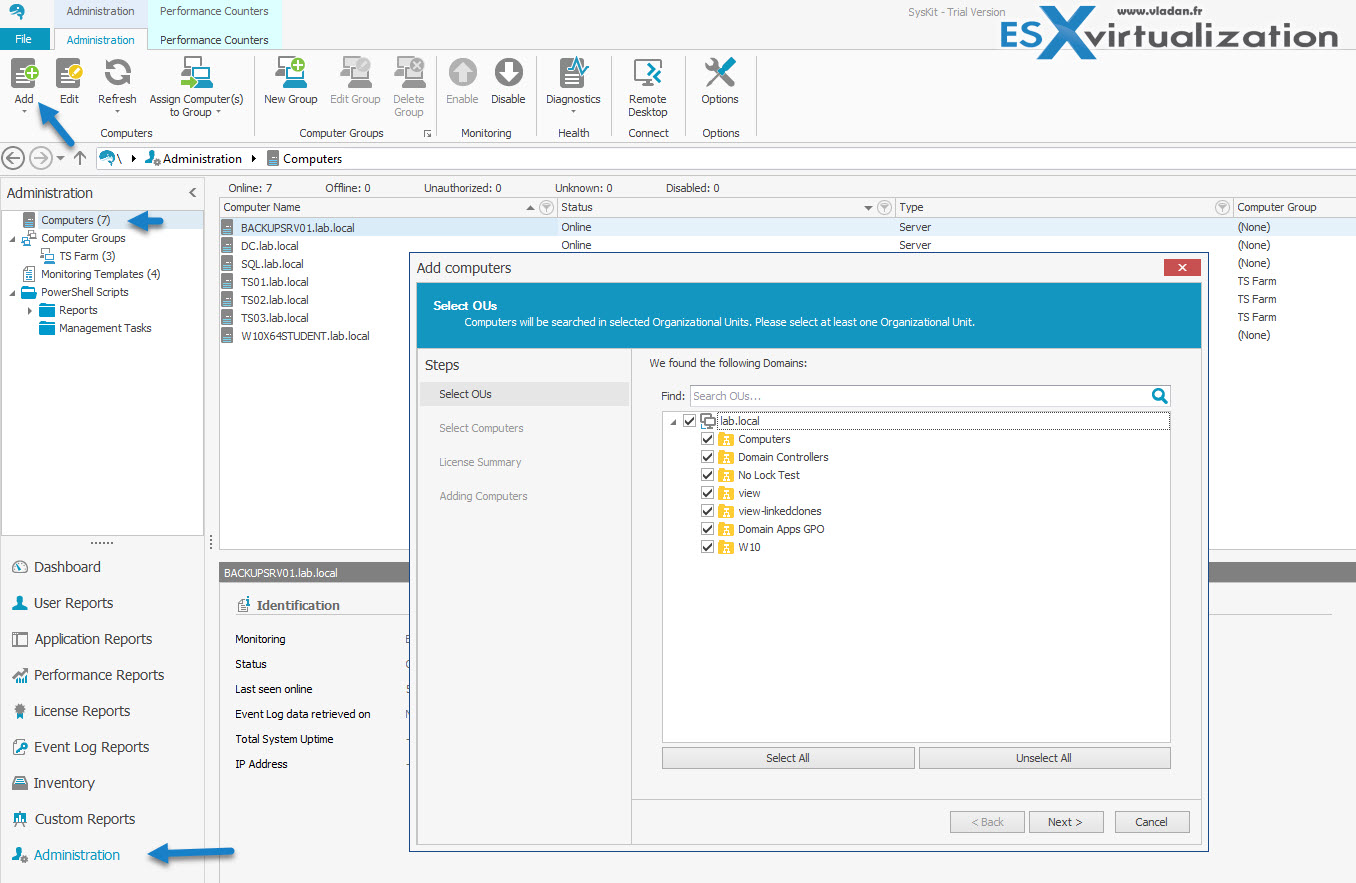
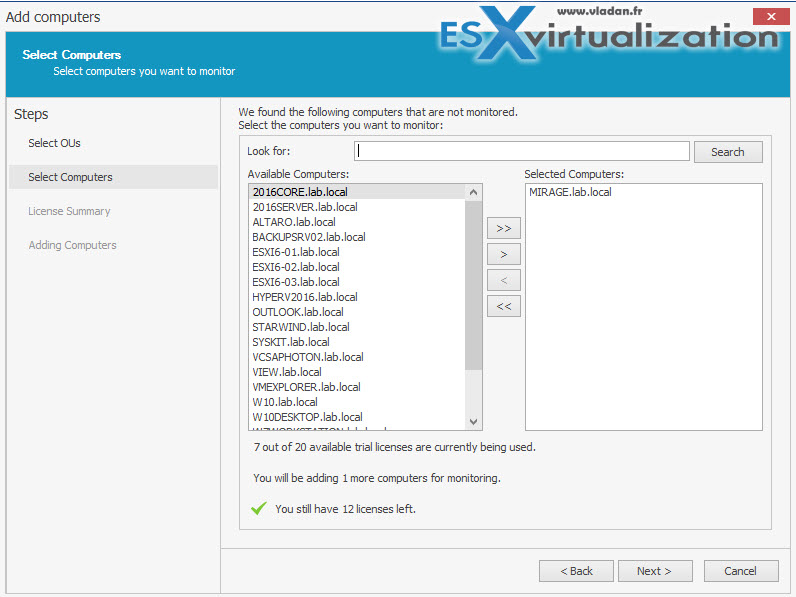
Then click “Next” to select the computers you want to monitor.
During the installation, SysKit discovers all available domains, including those for which you established domain trust. If you add a new domain to your environment after installing SysKit, you can include it to SysKit by selecting Administration > Options > AD Integration.
Dashboard
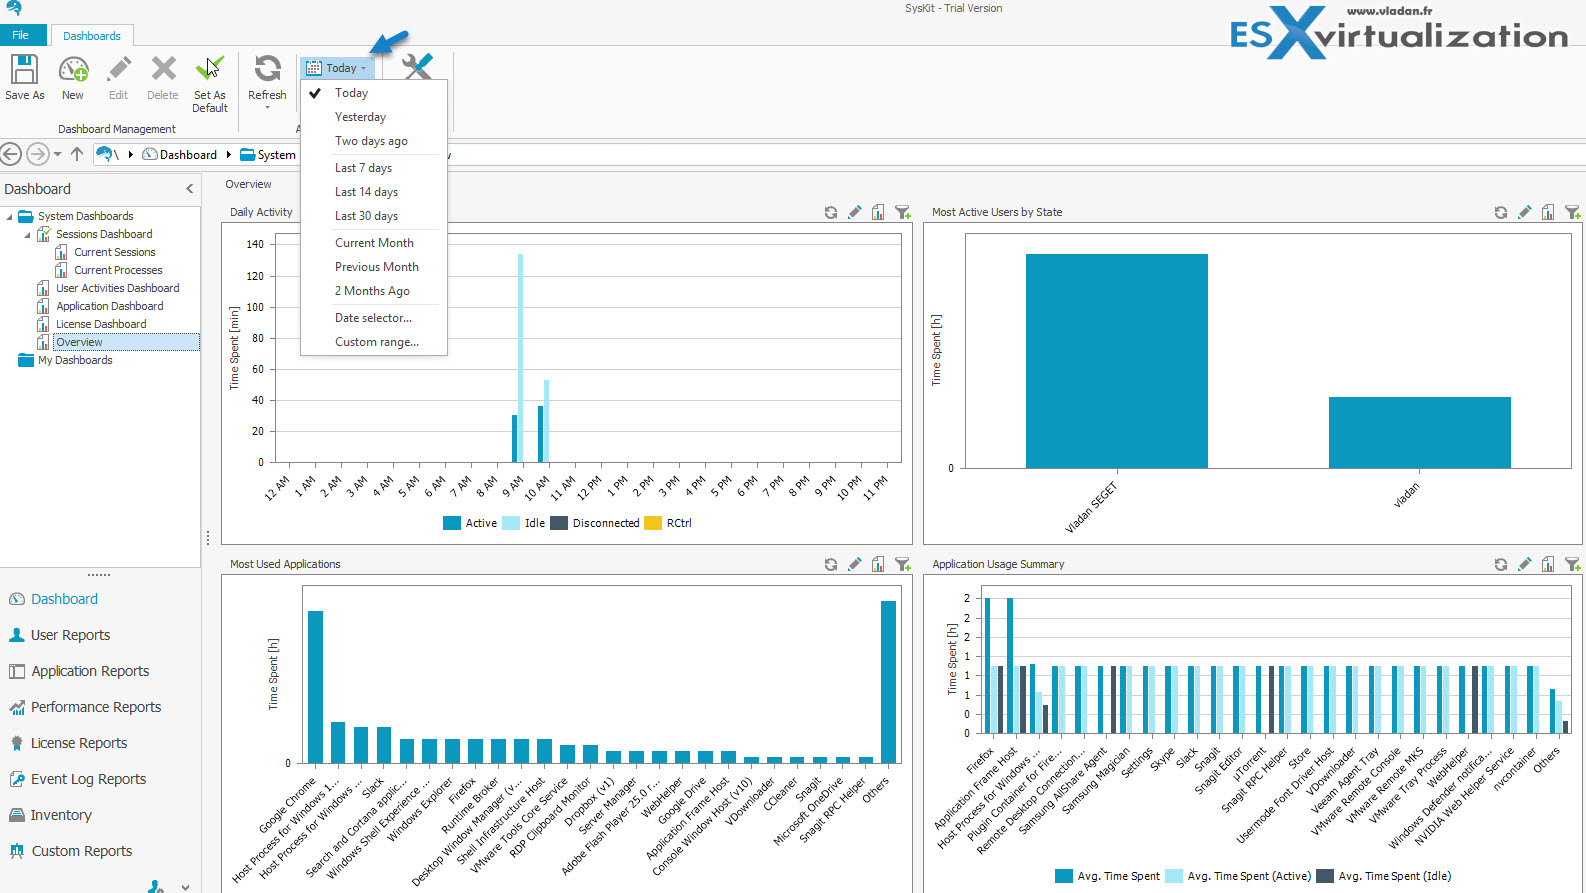
The product has some default built-in dashboards but also allows the creation of custom dashboards. And this is important because every admin wants and needs to adapt the product to fit his requirements. The predefined dashboards are:
- Sessions Dashboards – shows current sessions or current processes
- User Activities Dashboard – shows the active, idle, disconnected, or remotely controlled users.
- Application Dashboard – provides a view of most used applications, users per application, or an application usage summary
- License Dashboard – shows the license usage for your TS farm
- Overview Dashboard – shows an overview of apps, activities, and users
It's possible to show historical reports through the dashboards, too. For this, simply click the “Today” button, and select the date you want to show from the dropdown list.
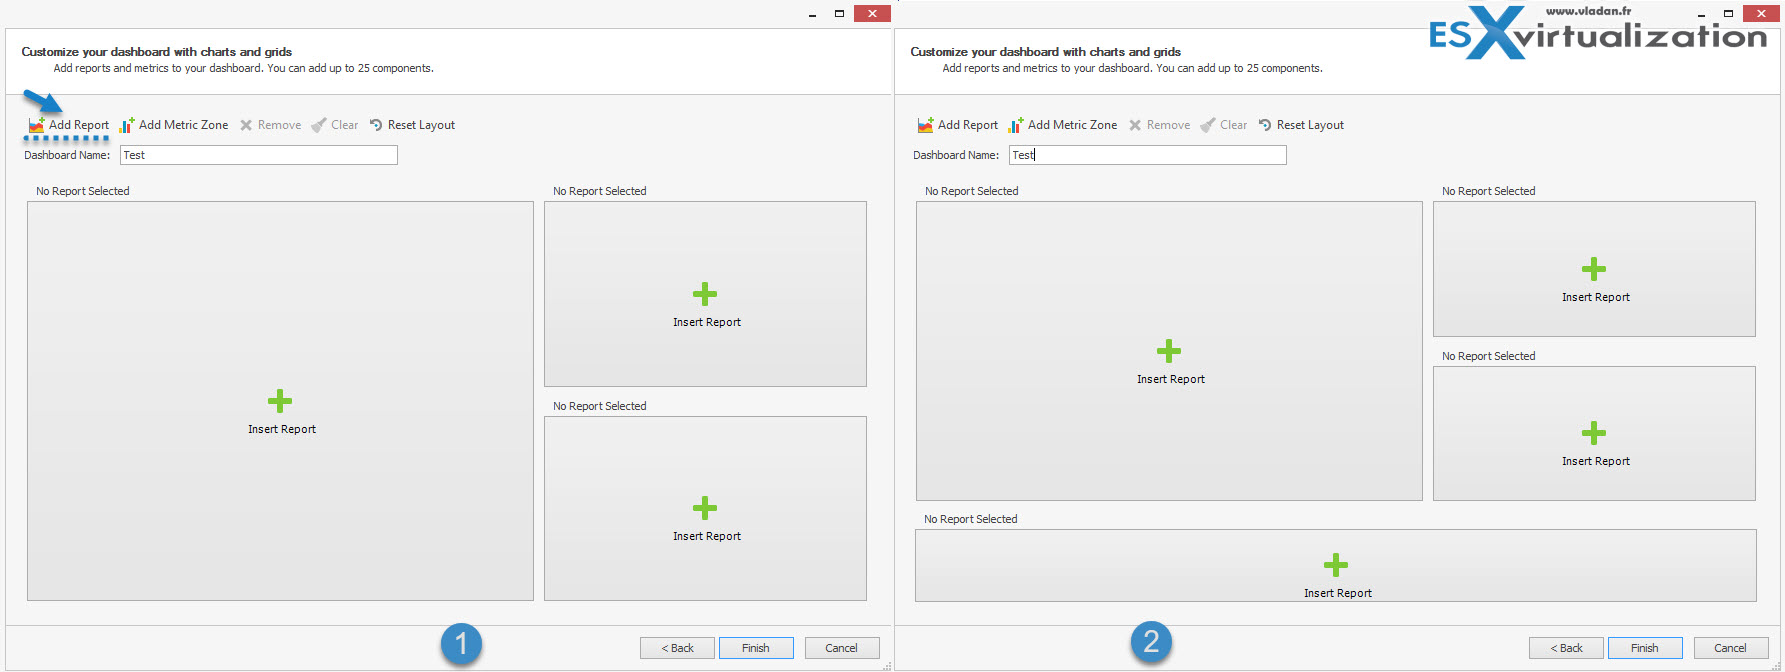
To add a custom report, you click the “New” button and choose a layout you want to use. Those layouts can be further personalized.
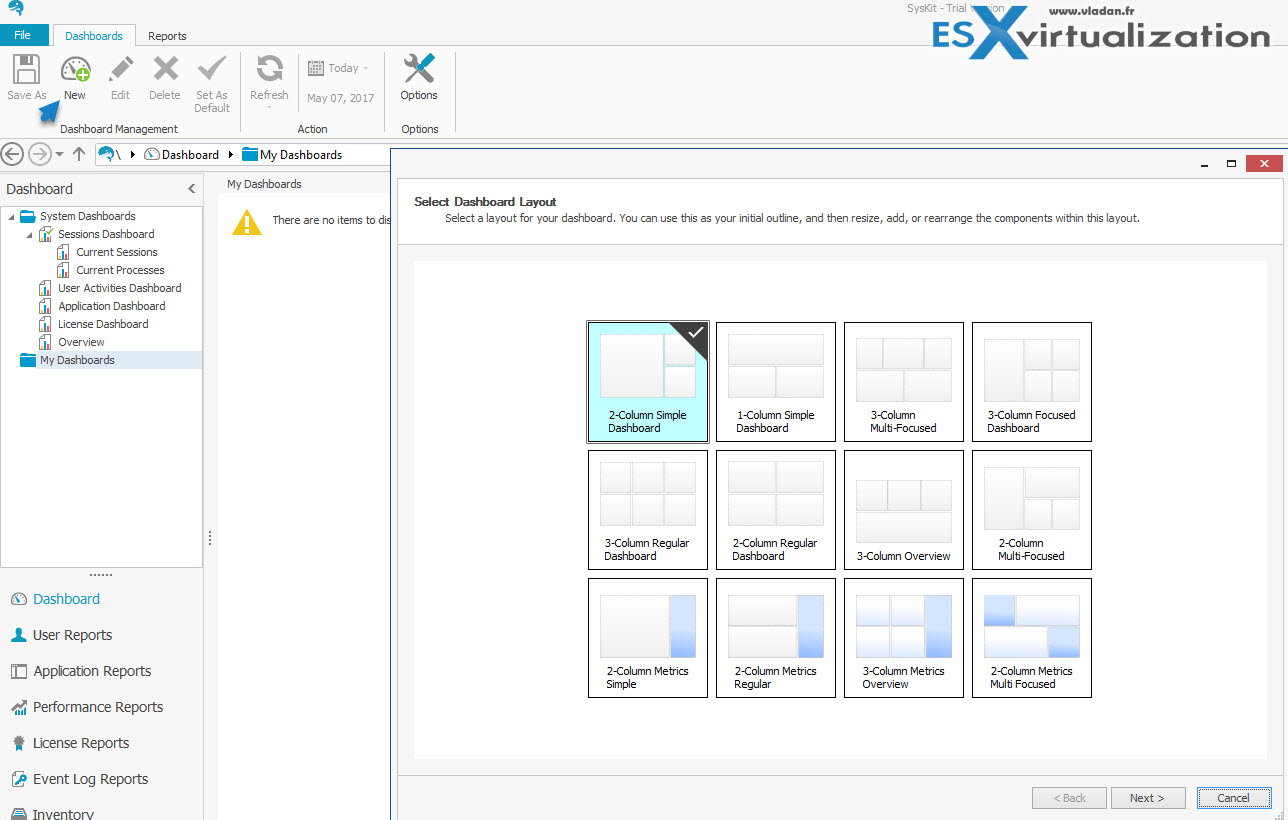
You can also:
- Add a report
- Add a metric zone
In the example below, I'm adding a report to the original model. Clicking the “Reset Layout” button resets the current layout back to the default.
User Activity Monitoring
SysKit is able to monitor user activity from RDS and ICA or users connected to their workstations. Whether they're active, idle, or disconnected, SysKit knows and reports on that.
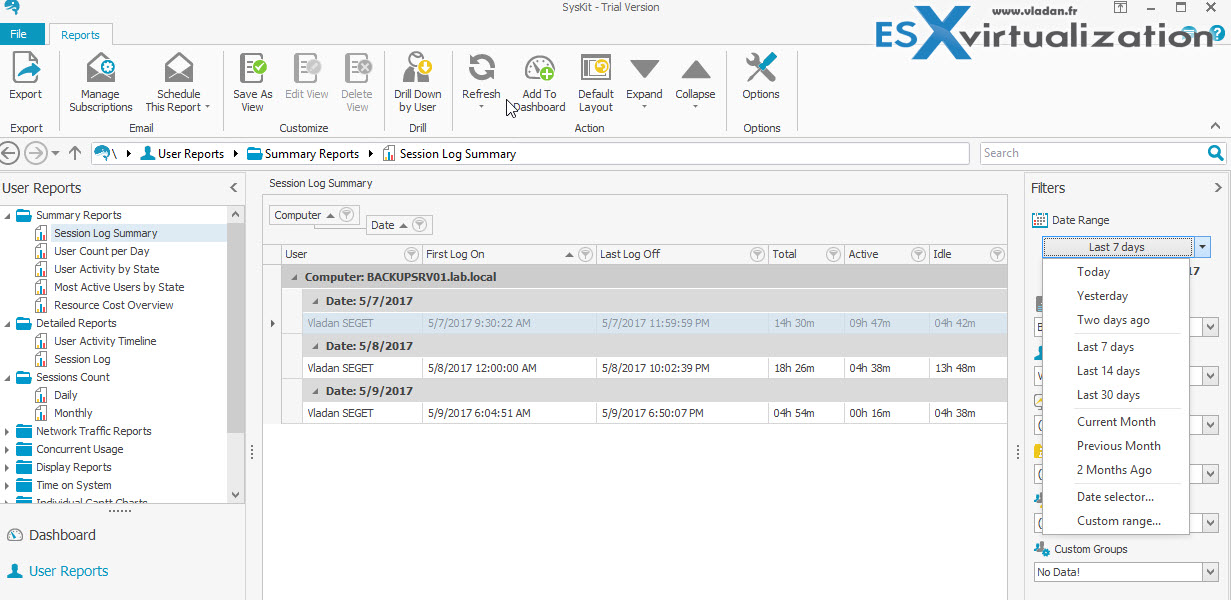
Some useful reports are:
- Session Log Summary – overall time that a user has been connected. You can specify data range (as per the screenshot below) and get a detailed overview of a user's activity
- Most Active Users – gives you details on which users were most active during a certain period of time
- User Count Per Day – number of users connecting daily
- IP Addresses and Clients – list of clients sorted by IP address
- Concurrent Usage Reports – reports for shared application and usage by multiple users
A SysKit administrator has the ability to sort connections via:
- IP address
- Client's name
- First login
- Total time
- Active time
- Idle time
Employee activity can be tracked and is useful for HR departments to prove which user did or did not connect to the system remotely on a particular day/week/month. It also enables you to generate bills according to actual working hours.
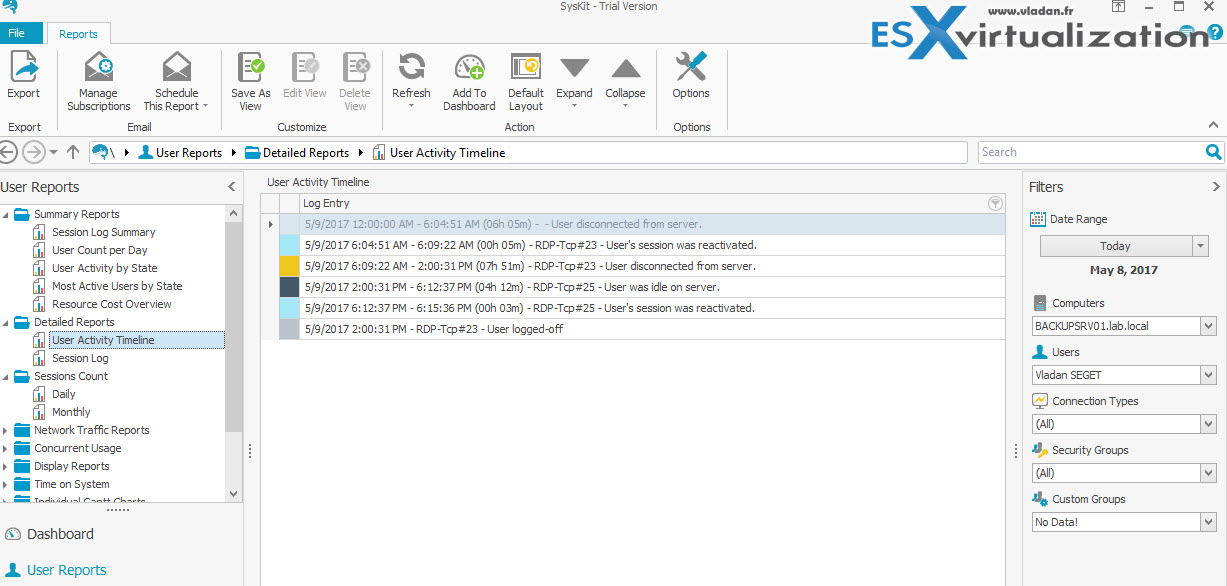
But there are many reports available, such as summary reports that give you a session log summary, user count per day, user activity by state, or most active users by state.
Then there are detailed reports, which can track activity details for a specific user on a specific server.
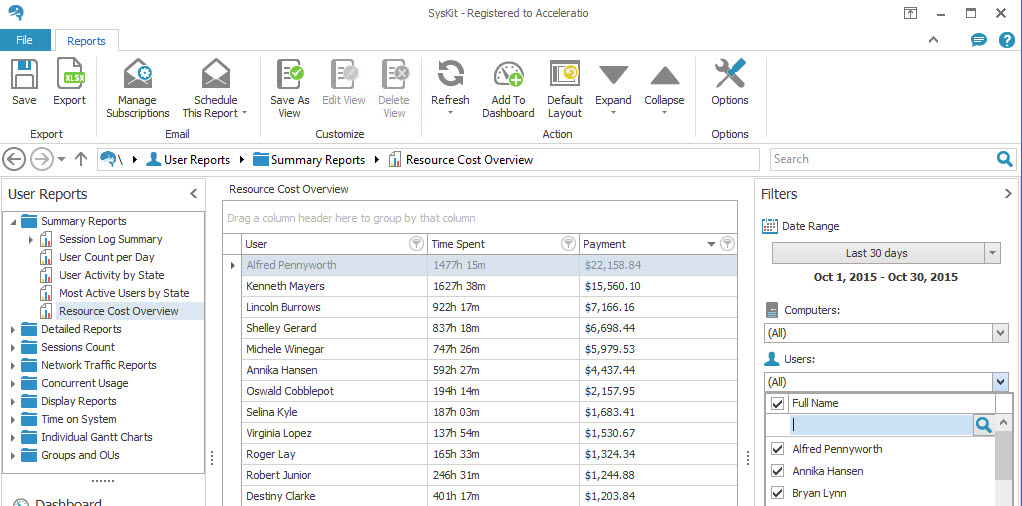
You also have the sessions count, which gives you an idea of how many sessions occurred over the selected time periods.
It's possible to drill down and track the daily or monthly activity of every user who connects remotely. You can even calculate payrolls for employees who have a defined hourly wage by providing a detailed report of their work.
Screenshot from SysKit website demonstrating the feature.
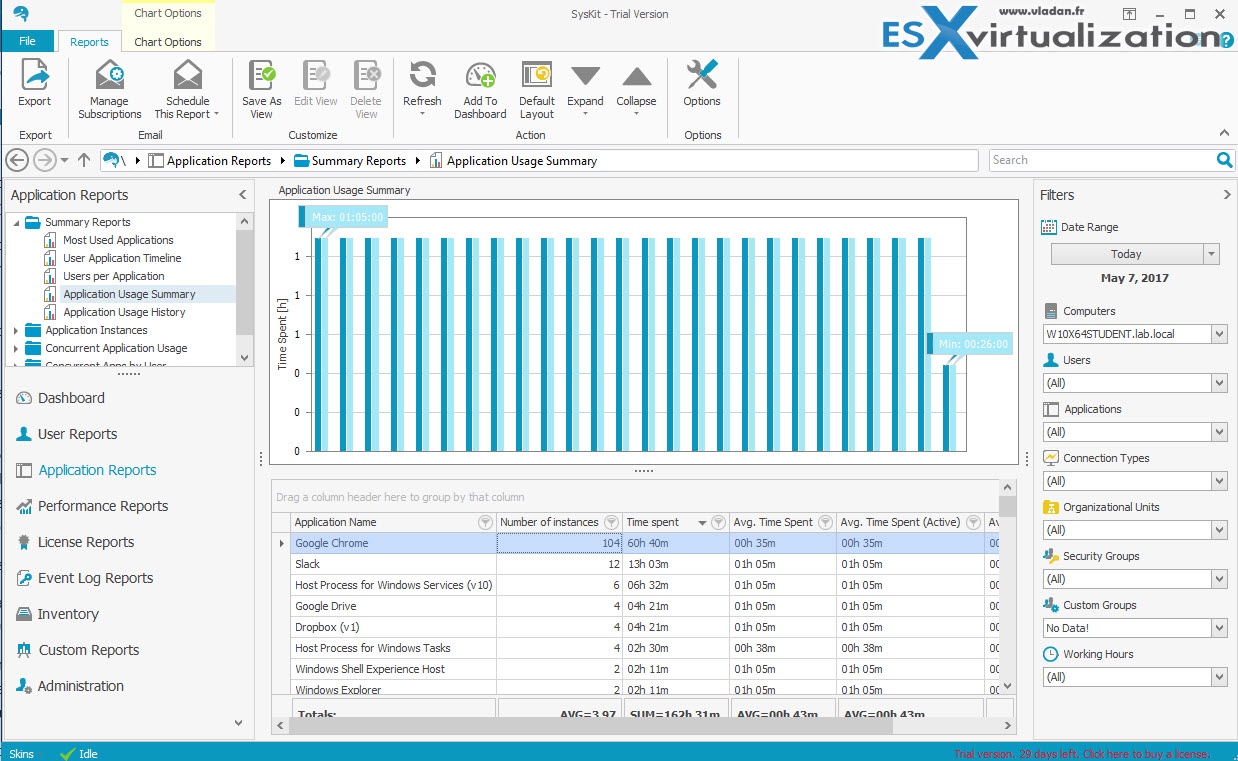
Monitoring application usage
Application reports allow you to view the most used applications for a specific system or time period. You can track a specific application, which user has used it, how long he/she has been idle, and when did that application start and stop. You can also check how many users have used this application during the specific period of time.
To access it, go to Application Reports > Summary Reports > Application Usage Summary.
You can sort the columns by Number of Instances, Time Spent, Avg. Time Spent, etc.
Performance Monitoring
Performance monitoring feature allows an administrator to monitor processes and services running on servers. You can track specific performance metrics like the number of transactions or users who access SharePoint or an SQL server.
It's possible to track all existing performance counters and services, and you can compare the performance values of two different servers.
Performance monitoring is easy with predefined monitoring templates. In addition to the built-in templates, you can download additional SysKit templates from SysKit web repository. Hyper-V, Citrix, or SQL monitoring templates are just some of the additional templates which further expand the monitoring capability of the product.
For example, the SharePoint Distributed Cache template monitors the most critical SharePoint performance for caching via its Distributed Cache service. This service is able to retrieve data without dependency on databases stored in SQL server. Predefined or imported templates can be modified, allowing you to choose counters and/or services you want to monitor for a specific number of servers.
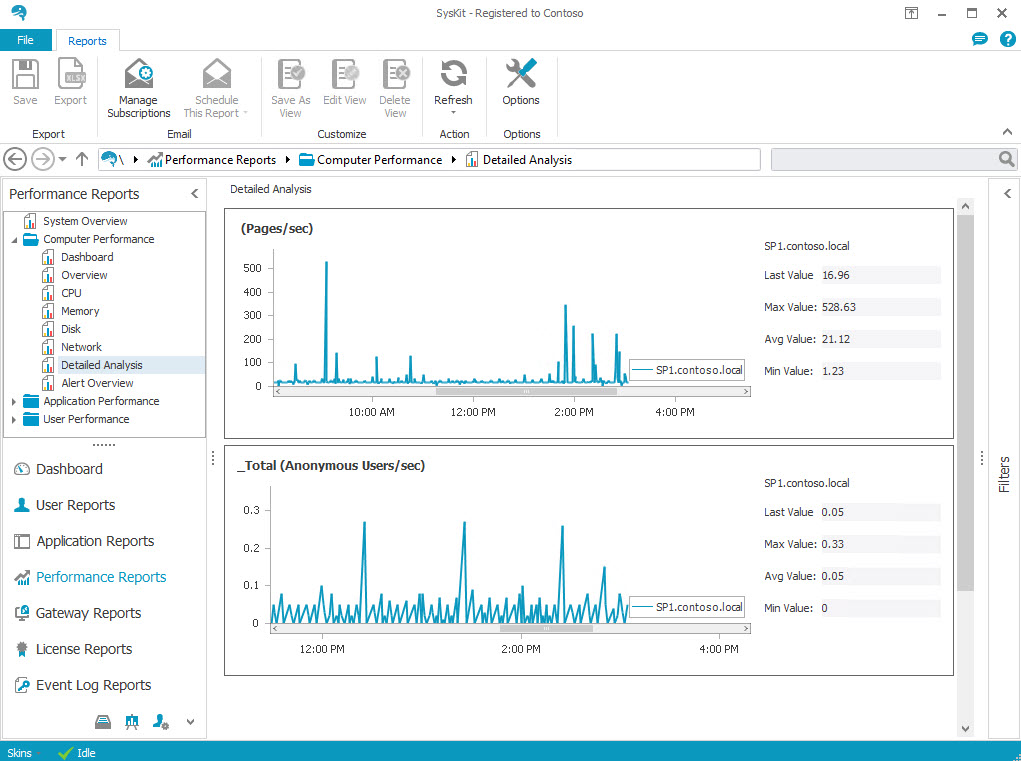
Screenshot from SysKit website shows detailed analysis report.
SysKit performance reports:
- CPU usage
- Memory usage
- Disk utilization and free space left
- Real-time and historical alerts
- Network bandwidth
- Specific performance counters, SQL transactions, IIS authenticated users, Citrix licensing…
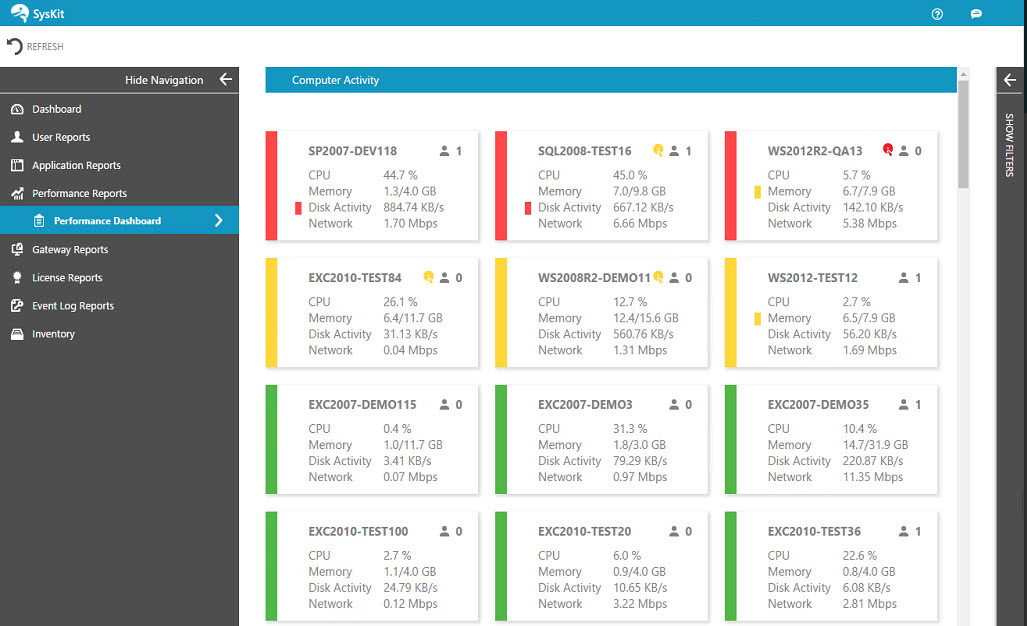
The real-time monitoring web app is pretty cool (Image from SysKit website)
Inventory
Inventory reports are based on regular snapshots of the monitored infrastructure. By comparing snapshots, you can detect changes on hardware or software. Often, when something goes wrong on a server, it's possible that configuration change, new patch, or hardware change is to blame. All of this can be tracked over time and different servers.
The hardware:
- Hard drives
- Network adapters
- Processors
- Printers
The software:
- Programs
- Available updates
- Installed updates
- Services
- Certificates
Local users and groups:
- Local admins
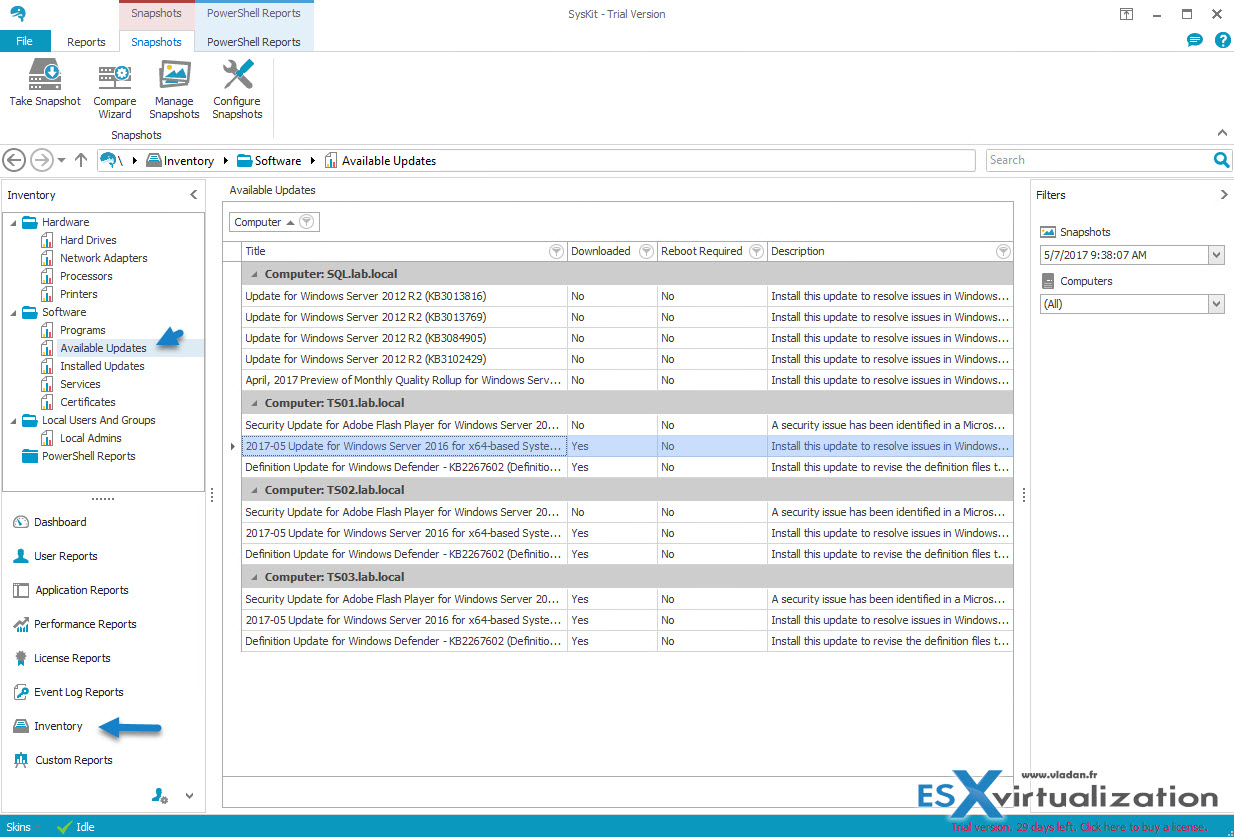
Screenshot from the lab showing the available updates. Were they already downloaded? Is a reboot required? You can click to enlarge and find out.
So, to compare two snapshots, you simply start the Compare Wizard by clicking the icon. Note that you can also compare computers in case you want to check inventory data or configuration on different machines. And it's possible to define mappings between computers from different environments and explore the differences within their inventories.
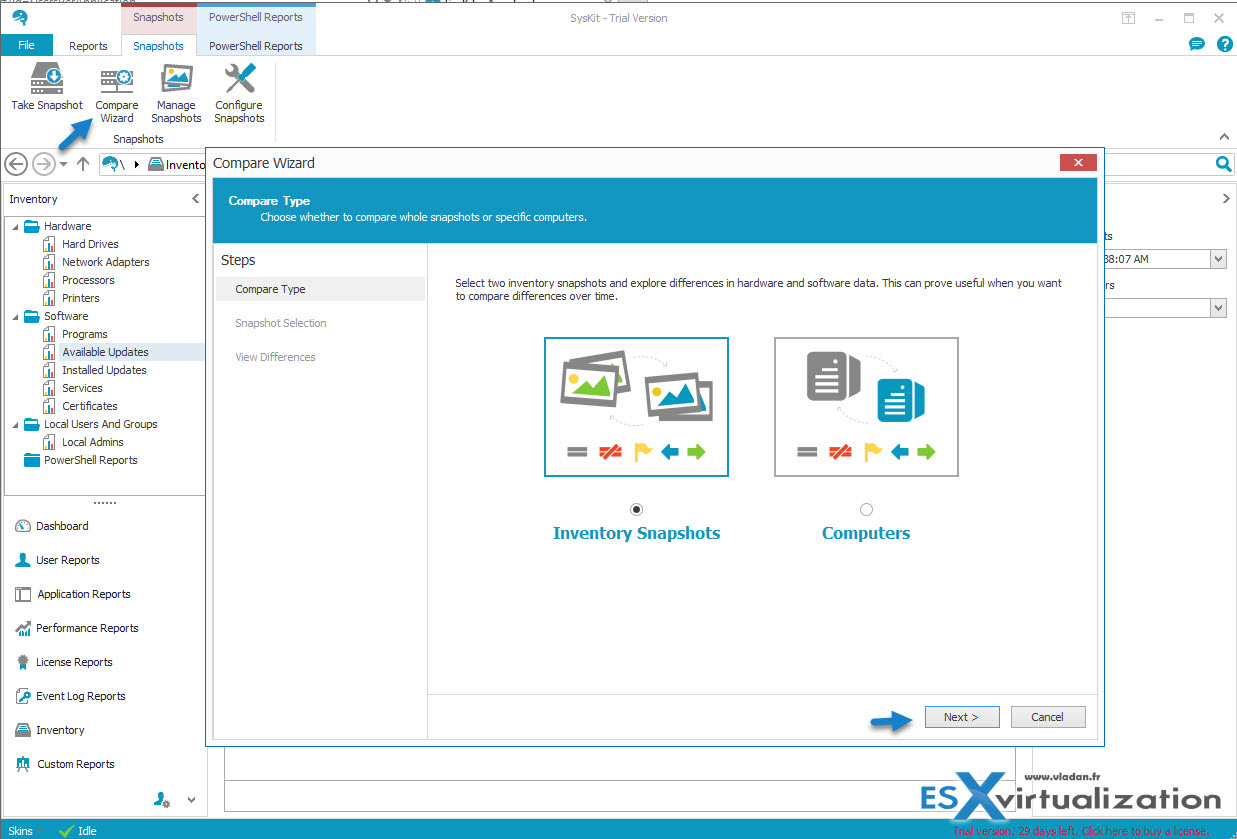
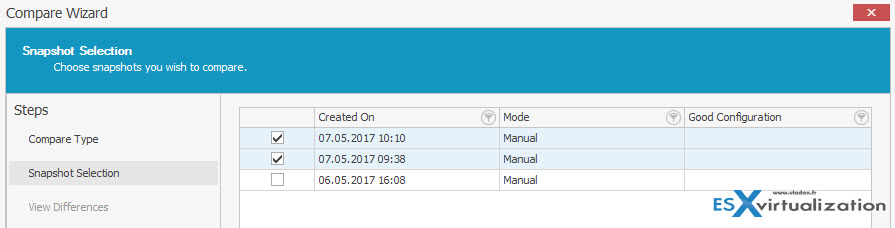
Then you pick the snapshots you want to compare. The inventory snapshots run on a schedule (which can be modified), but it's also possible to take a manual snapshot by clicking the “Take Snapshot” button in the menu.
And from the results, I can see some interesting things. Someone has installed a second NIC adapter. …It's missing in the snapshot on the left.
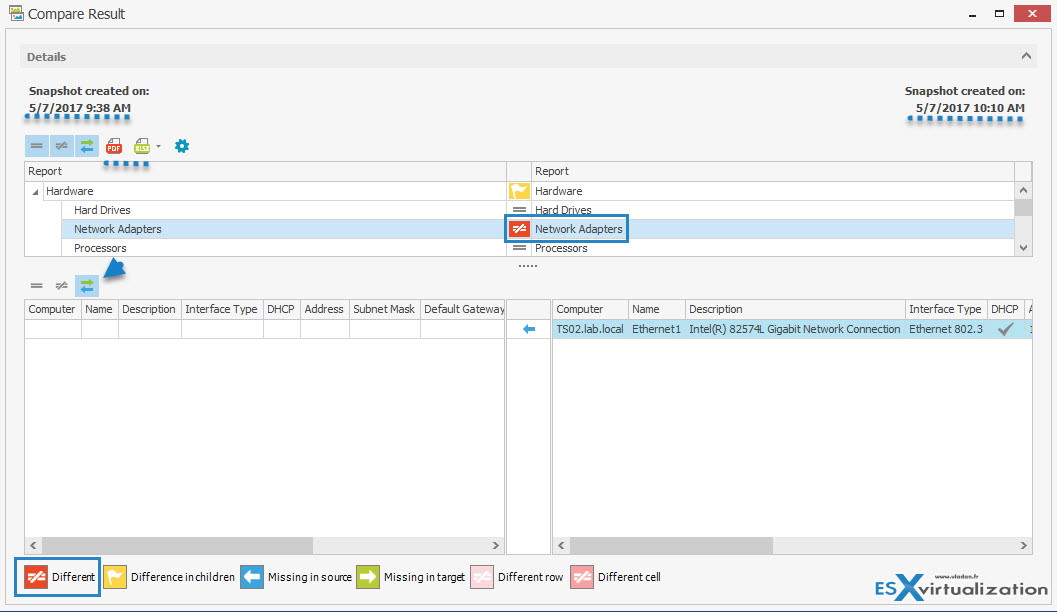
It's possible to export the results as a PDF or XLSX for further analysis.
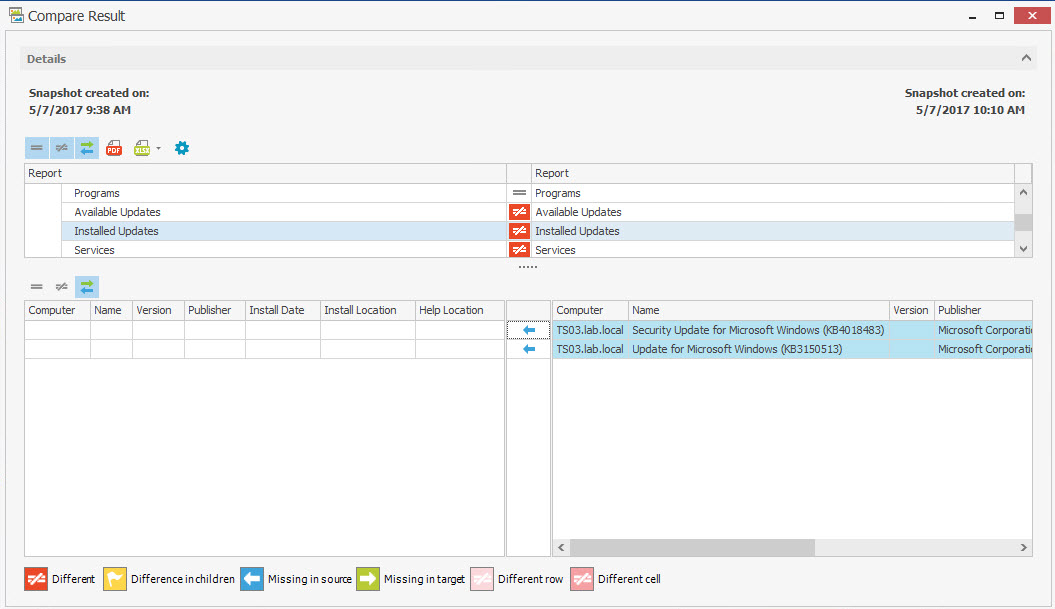
I can also see that my TS03 lab server has new patches installed, patches that are missing from the previous snapshot. Those two elements can be the root cause of a malfunction or performance degradation.
The product can obviously send all those reports by e-mail, and you can schedule when they will be run via the administration menu.
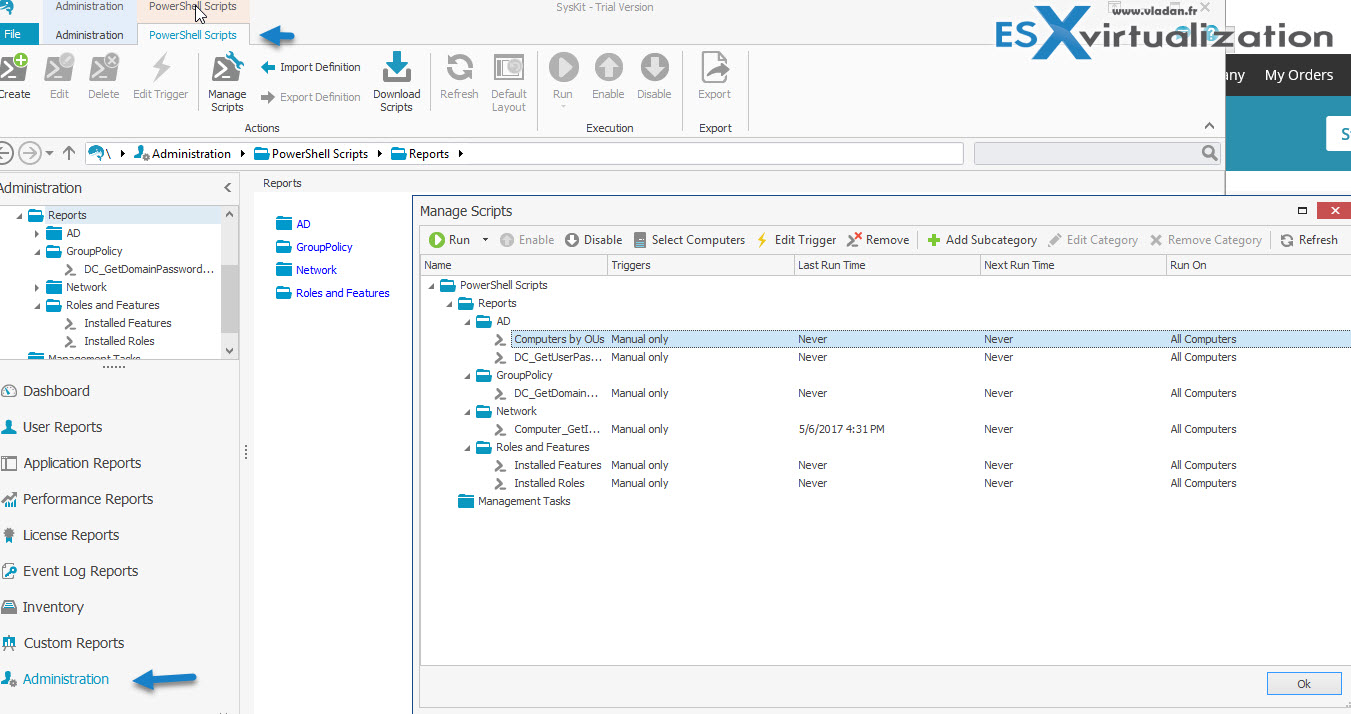
SysKit also has a neat PowerShell management feature and its own script repository. There are some basic built-in scripts, but you can add much more from the SysKit repository. By selecting the “Manage Scripts” button, you'll see which scripts are already installed. You can enable or disable a script or edit trigger where you can specify if the script will run manually or automatically, and you can schedule the runs, specific alerts for returned outputs, etc.
You can automate which servers scripts will run on and set a schedule or time between two runs. You can also write your own scripts and import them for usage in SysKit.
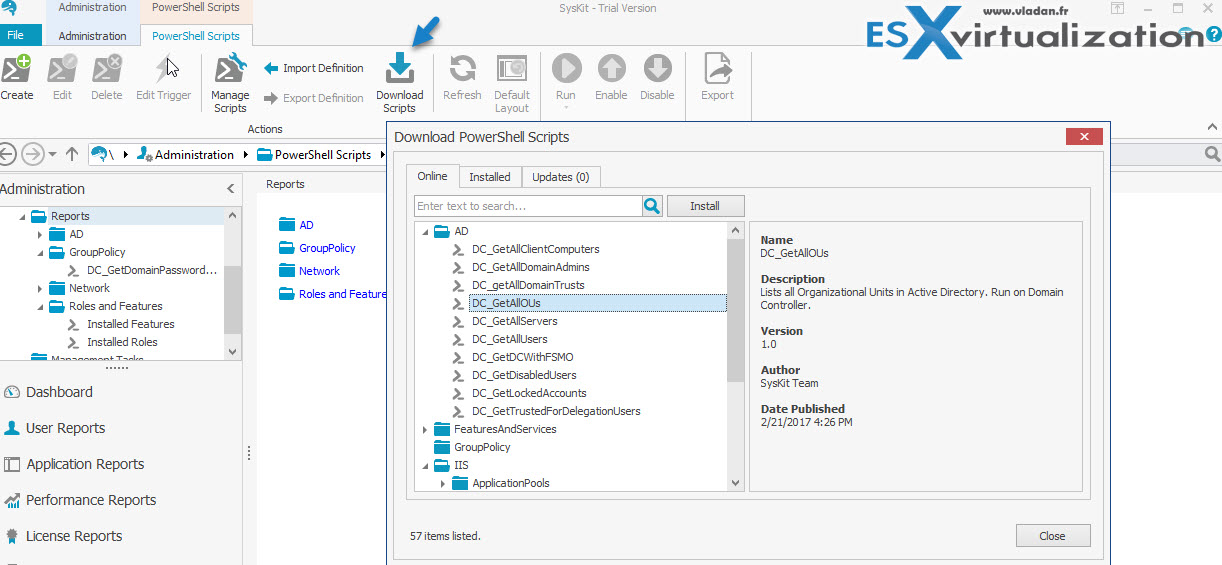
By clicking the “Download Scripts” button, you'll access the online repository, which provides more scripts from SysKit, sorted by category. Also, you can see which scripts have been installed and whether there are updates on existing scripts.
Working with the product
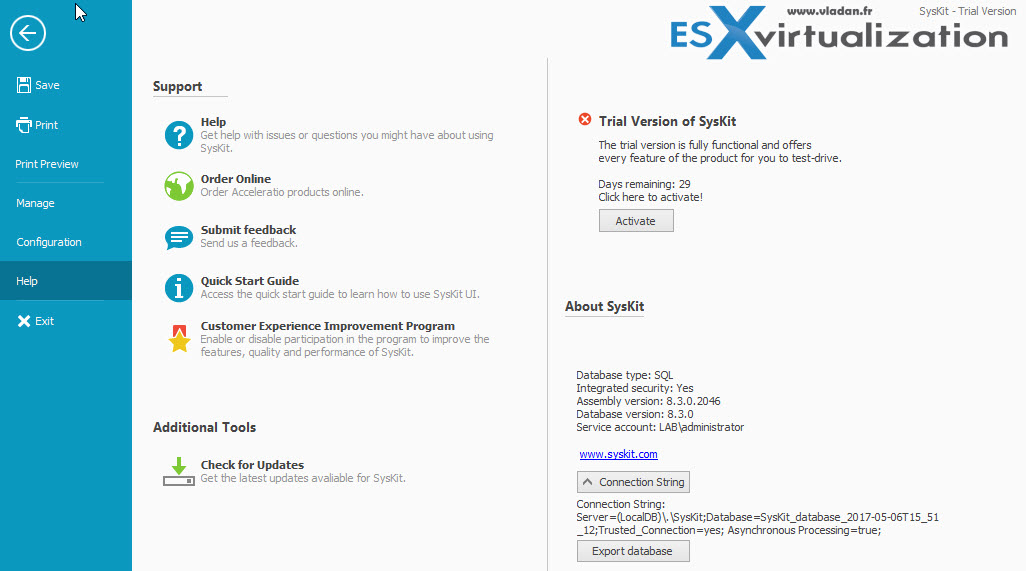
The UI is truly well done: It’s the Microsoft Office standard with a large ribbon at the very top. This kind of setup is now standard as it ensures the best user experience. You can easily get to the help section and configuration of the product via the “File” tab, accessible from anywhere.
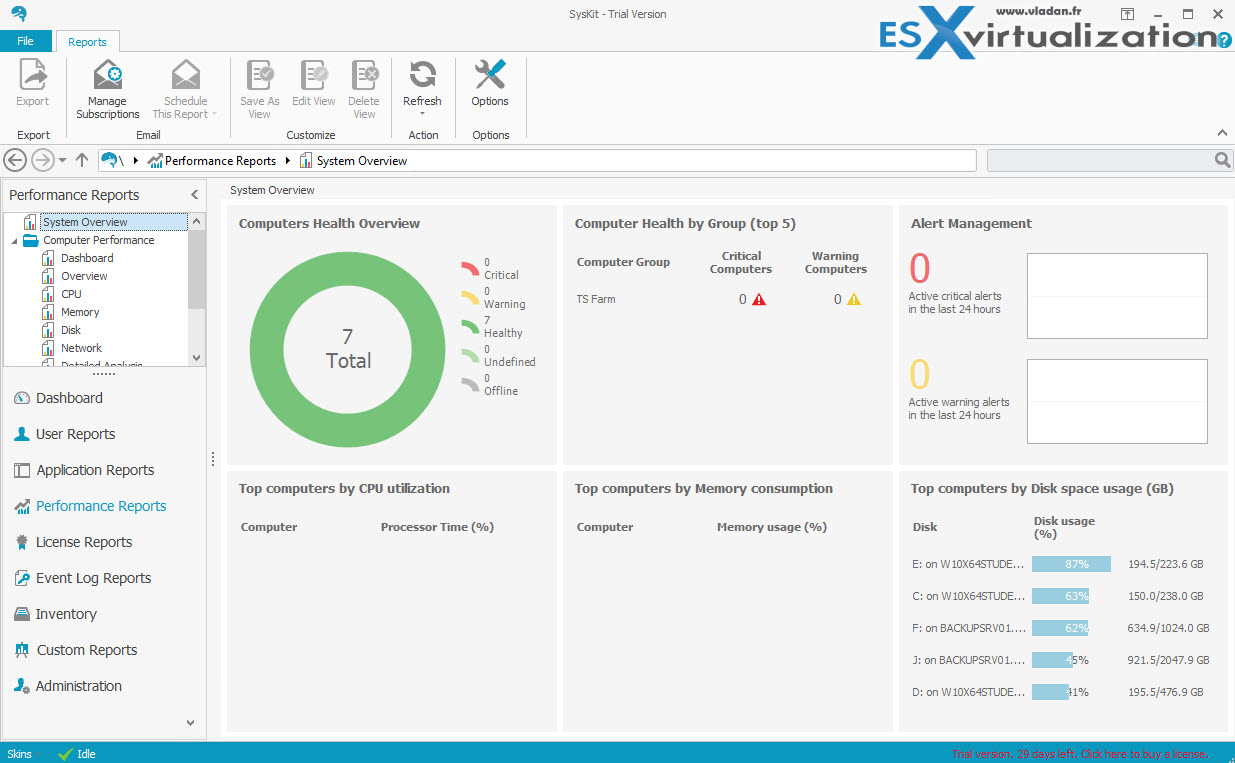
You can monitor server performance, user activity, application usage, and system inventory. The Performance Reports dashboard shows overall computer health with separate modules for:
- Top computers by CPU utilization
- Top computers by memory consumption
- Computer health by group (top 5)
- Alert management windows (last 24 hours)
- Top computers by disk space usage
You can subscribe to alerts via e-mail or let the system send subscriptions containing reports and views to a file share or to Microsoft SharePoint. You can define which reports will be sent for each subscription, including a schedule per subscription. Further, the reports can be viewed on a large TV screen or monitor for more convenience.
You'll certainly be interested in defining alerts on performance counters. You can enable alerting based on defined values for warnings and critical thresholds on performance counters. SysKit provides templates with performance counters for different server roles. The thresholds can be configured within the administration while enabling alerting is in the options menu.
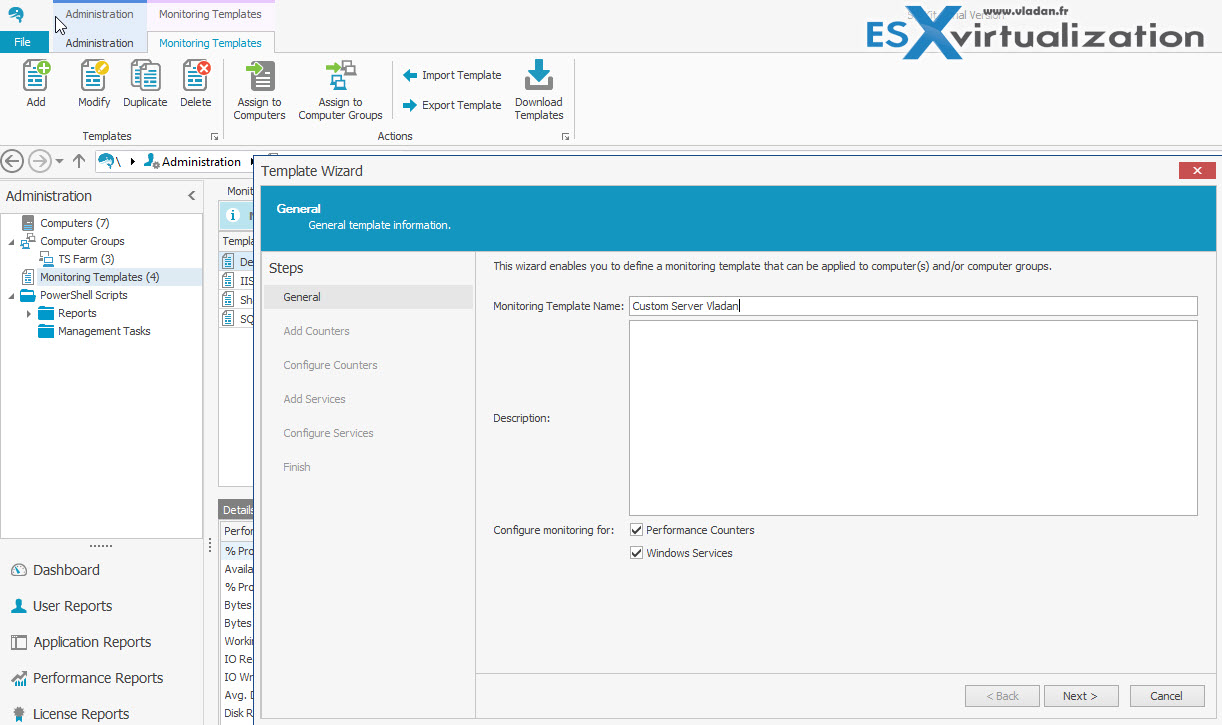
The best way to create a custom template with personalized counters is through the Template Wizard, which can be started by going to Administration > Monitoring Templates > Add. You can also duplicate existing templates so you don't have to start from scratch.
You can also download predefined performance monitoring templates from SysKit. Those templates were built by SysKit team and they expand the performance monitoring possibilities of the product. Simply click the “Download Templates” button to open a new window, and select the template you wish to download and install. You can read the description on the right-hand side.
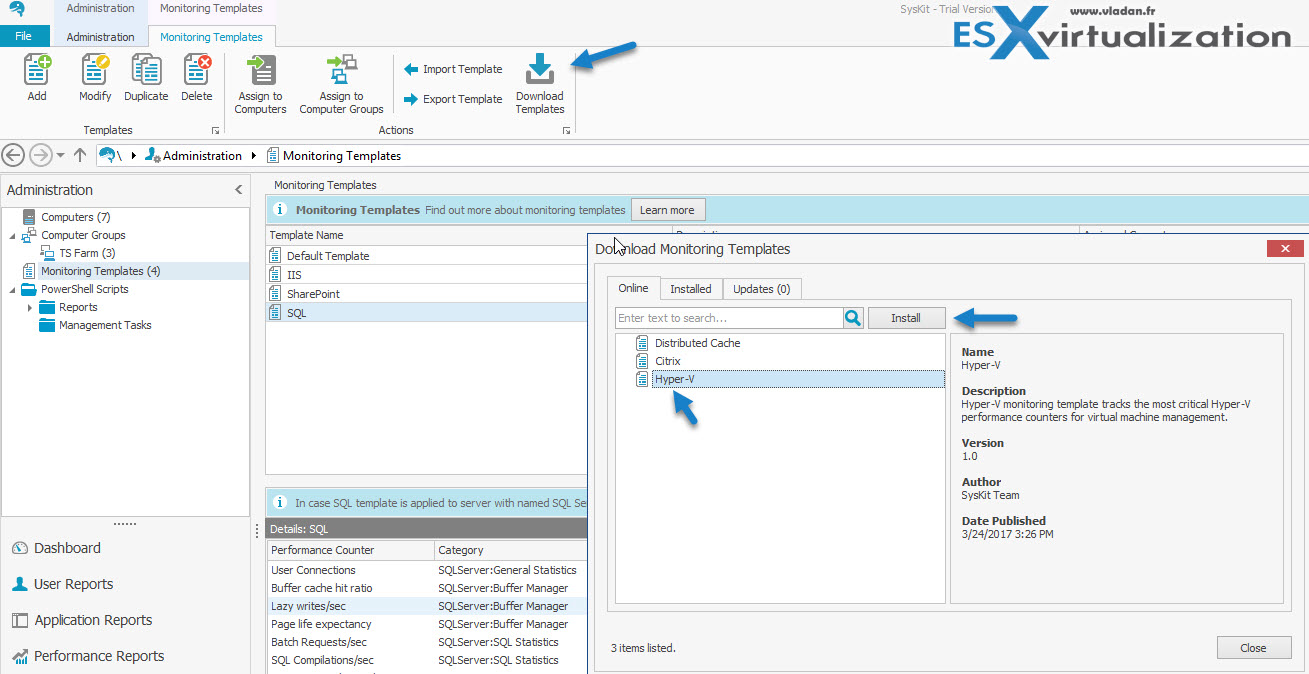
Above is an example of the Hyper-V monitoring template.
Wrap Up
The product is very easy to deploy, and adding individual servers or server groups is also easy because no agents are pushed to those remote systems. All data is gathered using APIs and WMI. This simplifies the operations. User or application activity can be checked not only via reporting, but also in real time. This lets you receive alerts on poor performance or degraded states of individual hosts or groups of systems.
Management can be done through the desktop app or, for remote or tablet users, via a web-based interface, which might also be used in the case you have a large TV screen where you want to create a big custom dashboard of your environment.
I really liked the inventory snapshot and compare functions. It's very useful to track changes in an environment over time, especially when several teams collaborate during multiple shifts. This is a feature that gives you an excellent view on what's changing within your infrastructure. While changes in hardware are perhaps not that frequent (for physical infrastructure), software changes are permanent and frequent. And the SysKit allows both to be monitored, including applications, services, and certificates.
Download SysKit 30 days trial.
About Acceleratio
Acceleratio Ltd. is a software development company specializing in creating high-quality enterprise monitoring and administration solutions for SharePoint, Office 365, Windows Servers, Remote Desktop Services, and Citrix admins and consultants across the globe. The company was founded in 2009 in Zagreb, Croatia. Acceleratio Ltd. has developed several innovative software products, such as SysKit, SPDocKit, and SQLDocKit.. These products are used on thousands of servers in more than 70 countries worldwide.
Note: This review was sponsored by Acceleratio.