
Welcome back to our VMware Certified Professional – VMware vSphere Foundation Administrator (2V0-16.25) study guide series! We follow the official VMware Blueprint for the exam – VMware vSphere Foundation Administrator (PDF). This section is part of the upcoming VCP-VVF Study Guide Page, which will be released as a PDF when completed—check it out at https://www.vladan.fr/vcp-vvf-administrator/. Today, we’re continuing with Objective 4.3 – VVF: Operate, focusing on Given a scenario, monitor vSAN storage using VCF Storage Operations – Part 13.
In VMware vSphere Foundation (VVF) 9.0, VMware Cloud Foundation (VCF) Storage Operations, integrated with VMware Aria Operations (formerly vRealize Operations), provides tools to monitor vSAN storage health, performance, and capacity. This objective is critical for the 2V0-16.25 exam, testing your ability to use VCF Storage Operations to monitor vSAN metrics, detect issues, and ensure storage reliability in real-world scenarios. Building on our previous posts (Objective 4.2, Parts 1-4, covering VVF management tasks, and Objective 4.3, Parts 1-12, covering VCF Operations setup, monitoring, dashboards, log analysis, costing, and integrations), we’ll provide a detailed guide to monitoring vSAN storage using VCF Storage Operations, practical insights, and exam-focused guidance using a realistic scenario, aligned with VMware’s official vSphere 9.0 and VCF 9.0 documentation (https://techdocs.broadcom.com/us/en/vmware-cis/vsphere/vsphere/9-0.html and https://techdocs.broadcom.com/us/en/vmware-cis/vcf/vcf-9-0-and-later/9-0/infrastructure-operations.html). Let’s have a look into vSAN monitoring with VCF Storage Operations!
Why Monitoring vSAN Storage with VCF Storage Operations Matters
In VVF 9.0, vSAN provides hyper-converged storage for the Software-Defined Data Center (SDDC), and VCF Storage Operations offers a centralized platform to monitor vSAN health, performance, and capacity metrics, such as disk latency, IOPS, and available storage. Effective monitoring ensures administrators can detect issues like disk failures, capacity shortages, or performance bottlenecks, maintaining reliability for VMs and Kubernetes workloads. Objective 4.3 tests your ability to use VCF Storage Operations to monitor vSAN in scenarios involving storage troubleshooting or capacity planning. This chapter (Part 13) focuses on a scenario involving vSAN monitoring, complementing Part 12 (VCF Operations integrations) and Part 11 (costing and pricing).
Scenario: Monitoring vSAN Storage Using VCF Storage Operations
Let’s use a typical exam scenario: A medium-sized business has a VVF 9.0 environment with a 4-host cluster (“VVF-Cluster”) running 20 VMs (10 web servers, 5 databases, 5 VDI desktops) on a vSAN datastore (“vSAN-Datastore”), managed by vCenter 9.0 (IP: 192.168.1.20, hosts at 192.168.1.10-13). The environment includes vSphere HA, DRS, a vSphere Distributed Switch (“vDS-VVF”), an NSX deployment (manager IP: 192.168.10.60), a Supervisor for Kubernetes workloads in “Microservices-Namespace” (Objective 4.1, Part 3), a VCF Operations instance (“vcf-operations-vm”, IP 192.168.10.54, Objective 4.2, Part 2), and a VCF Operations for Logs instance (“vcf-logs-vm”, IP 192.168.10.55, Objective 4.3, Part 3). After integrating vSAN with VCF Operations (Part 12), the storage admin reports performance issues with database VMs and capacity concerns on “vSAN-Datastore”. You must: use VCF Storage Operations to monitor vSAN storage health, performance, and capacity, identify issues affecting database VMs, recommend corrective actions, and ensure no disruption to other workloads. This scenario tests your ability to monitor vSAN storage using VCF Storage Operations for the 2V0-16.25 exam.
Monitoring vSAN Storage Using VCF Storage Operations
Below, we detail the process for monitoring vSAN storage in VCF Storage Operations to assess health, performance, and capacity, identify issues affecting database VMs, and recommend corrective actions. The steps are verified against VMware vSphere 9.0 and VCF 9.0 documentation (https://techdocs.broadcom.com/us/en/vmware-cis/vsphere/vsphere/9-0/vsphere-monitoring-and-performance.html and https://techdocs.broadcom.com/us/en/vmware-cis/vcf/vcf-9-0-and-later/9-0/infrastructure-operations.html).
Accessing VCF Storage Operations
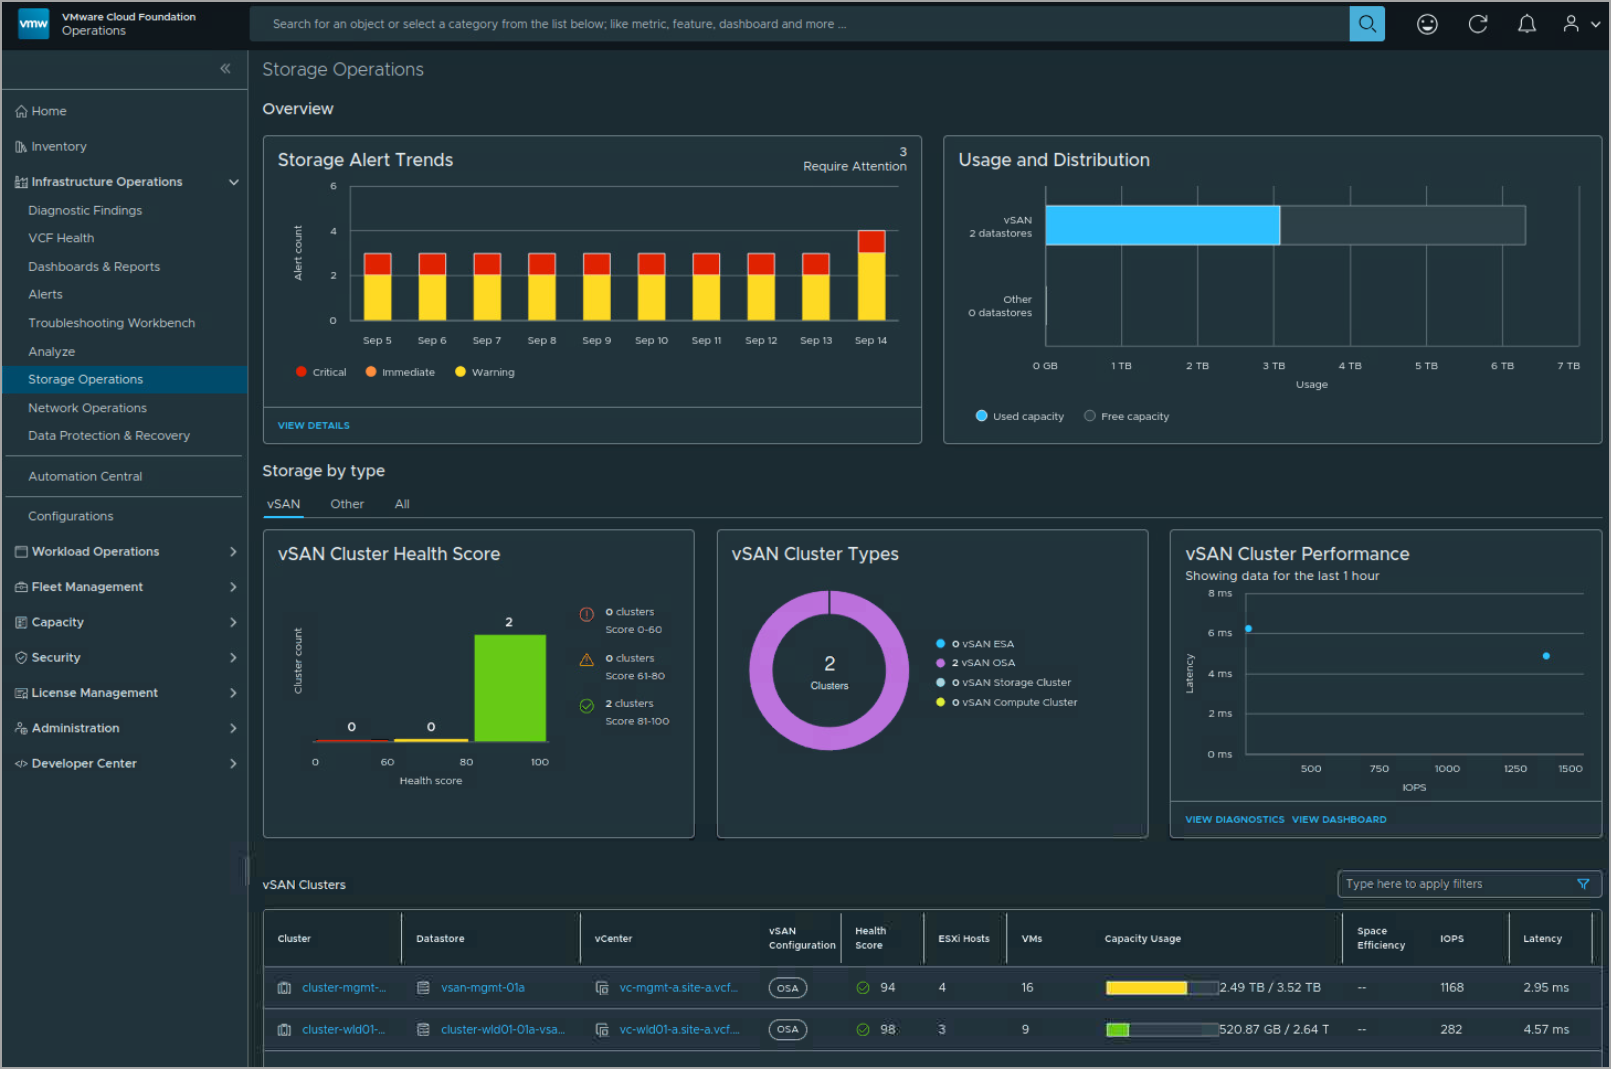
Description: Log in to VCF Operations and navigate to the vSAN monitoring section.Process:
- Access VCF Operations:
- Open a browser and navigate to https://192.168.10.54.
- Log in with admin credentials (e.g., [email protected]).
- Navigate to vSAN Monitoring:
- From the left menu, click Environment > Inventory > vSAN.
- Select “vSAN-Datastore” to view the vSAN monitoring interface.
- Alternatively, go to Dashboards > VMware vSAN > vSAN Health for a consolidated view.
Verification:
- Confirm successful login to the VCF Operations UI.
- Ensure the vSAN section loads and displays “vSAN-Datastore” metrics.
Documentation Reference: vSAN monitoring is covered in the vSphere 9.0 documentation under “vSphere Monitoring and Performance” https://techdocs.broadcom.com/us/en/vmware-cis/vsphere/vsphere/9-0/vsphere-monitoring-and-performance.html.Scenario Example: Log in to VCF Operations (192.168.10.54) and navigate to Environment > Inventory > vSAN to monitor “vSAN-Datastore”.
Monitoring vSAN Health
Description: Use VCF Storage Operations to check vSAN health metrics, such as disk group status and component errors.
Process:
- Access vSAN Health Dashboard:
- In VCF Operations, navigate to Dashboards > VMware vSAN > vSAN Health.
- Select “vSAN-Datastore” to view health metrics.
- Check Health Metrics:
- Review key indicators:
- Cluster Health: Ensure “VVF-Cluster” shows a green status.
- Disk Group Status: Verify all disk groups (across hosts 192.168.1.10-13) are healthy.
- Component Health: Check for failed or degraded components.
- Resync Status: Confirm no excessive resync operations.
- Look for alerts, e.g., “Disk failure on host 192.168.1.11” or “Component limit exceeded”.
- Review key indicators:
- Analyze Issues:
- Example finding: “Disk failure” alert on host 192.168.1.11, affecting a disk group in “vSAN-Datastore”.
Verification:
- Confirm health metrics display for “vSAN-Datastore”.
- Identify any critical alerts (e.g., disk failure on 192.168.1.11).
Documentation Reference: vSAN health monitoring is detailed in the vSphere 9.0 documentation under “vSphere Monitoring and Performance” https://techdocs.broadcom.com/us/en/vmware-cis/vsphere/vsphere/9-0/vsphere-monitoring-and-performance.html.Scenario Example: Use the vSAN Health dashboard to identify a disk failure on host 192.168.1.11.
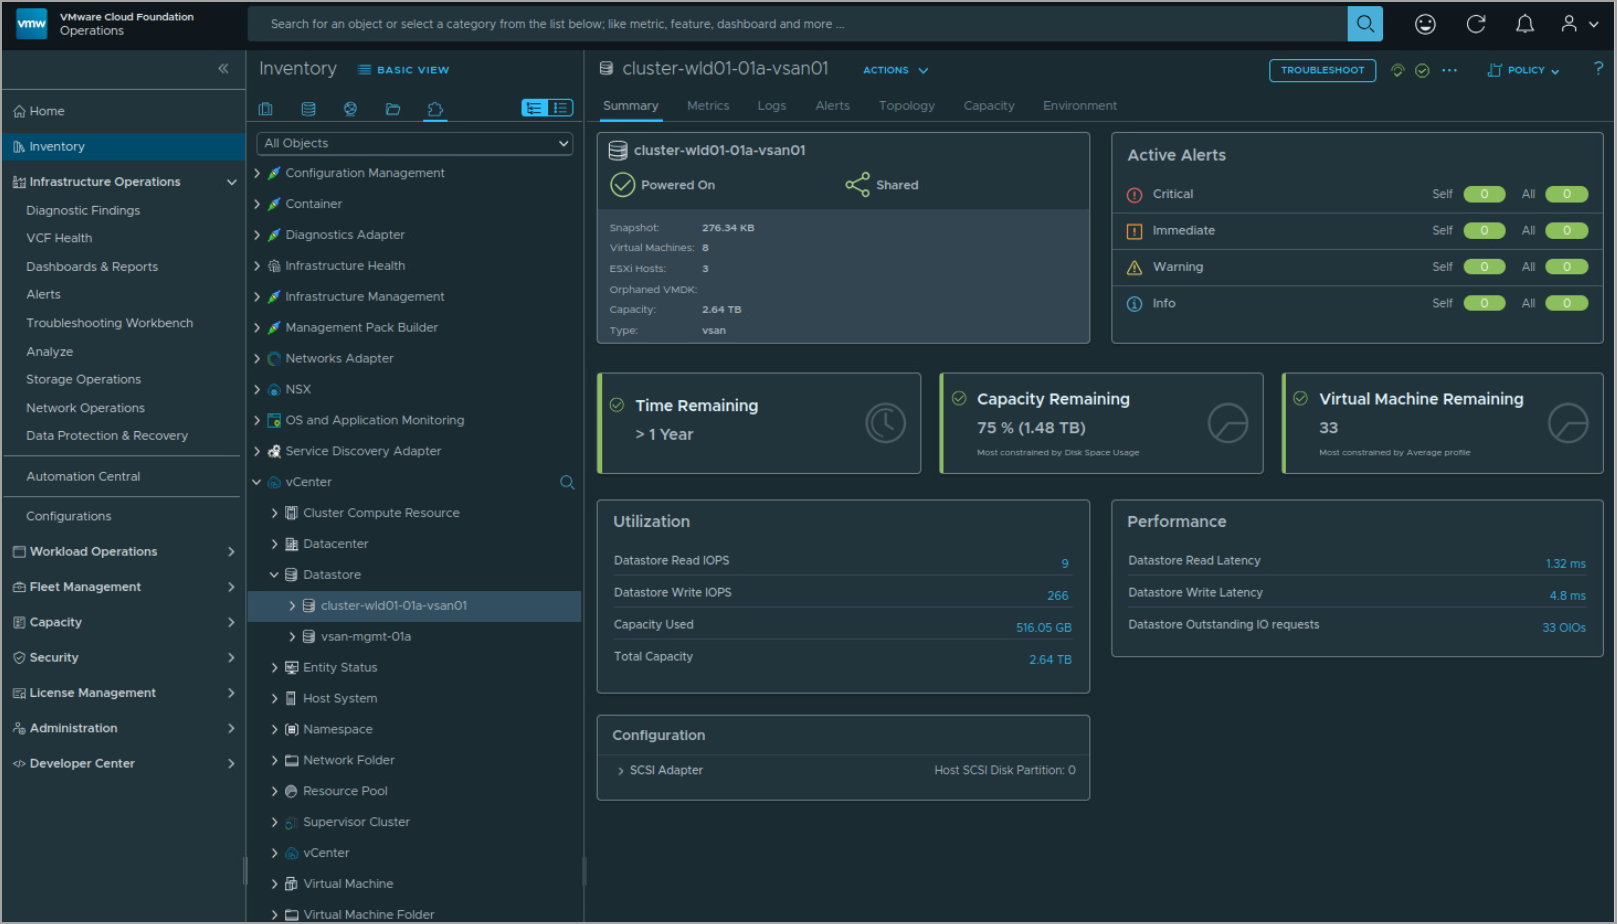
Monitoring vSAN Performance
Description: Monitor vSAN performance metrics, such as latency and IOPS, to identify issues affecting database VMs.
Process:
- Access vSAN Performance Dashboard:
- In VCF Operations, navigate to Dashboards > VMware vSAN > vSAN Performance.
- Select “vSAN-Datastore” to view performance metrics.
- Check Performance Metrics:
- Review key indicators:
- Read/Write Latency: Check for high latency (e.g., >5ms for database VMs).
- IOPS: Verify IOPS meet database VM requirements (e.g., 5000 IOPS for “database-01”).
- Throughput: Ensure sufficient throughput for VM workloads.
- Filter for database VMs (Object Type: Virtual Machine, Name: database).
- Review key indicators:
- Analyze Issues:
- Example finding: High write latency (10ms) on “vSAN-Datastore” for “database-01” and “database-02” hosted on 192.168.1.11, correlating with the disk failure from Step 2.
Verification:
- Confirm performance metrics display for “vSAN-Datastore” and database VMs.
- Identify high latency or low IOPS affecting “database-01” and “database-02”.
Documentation Reference: vSAN performance monitoring is covered in the vSphere 9.0 documentation under “vSphere Monitoring and Performance” https://techdocs.broadcom.com/us/en/vmware-cis/vsphere/vsphere/9-0/vsphere-monitoring-and-performance.html.Scenario Example: Use the vSAN Performance dashboard to identify high write latency (10ms) for database VMs on “vSAN-Datastore”.
Monitoring vSAN Capacity
Description: Monitor vSAN capacity metrics to assess storage usage and plan for growth.
Process:
- Access vSAN Capacity Dashboard:
- In VCF Operations, navigate to Dashboards > VMware vSAN > vSAN Capacity.
- Select “vSAN-Datastore” to view capacity metrics.
- Check Capacity Metrics:
- Review key indicators:
- Total Capacity: Verify total storage (e.g., 20TB for “vSAN-Datastore”).
- Used Capacity: Check used space (e.g., 15TB used).
- Free Capacity: Ensure sufficient free space (e.g., <80% utilization to avoid bottlenecks).
- Deduplication/Compression Savings: Confirm efficiency metrics.
- Look for warnings, e.g., “Capacity utilization above 80%”.
- Review key indicators:
- Analyze Issues:
- Example finding: “vSAN-Datastore” at 85% capacity, risking performance degradation.
Verification:
- Confirm capacity metrics display for “vSAN-Datastore”.
- Identify high utilization (85%) as a potential issue.
Documentation Reference: vSAN capacity monitoring is detailed in the VCF 9.0 documentation under “Infrastructure Operations” https://techdocs.broadcom.com/us/en/vmware-cis/vcf/vcf-9-0-and-later/9-0/infrastructure-operations.html.Scenario Example: Use the vSAN Capacity dashboard to identify 85% utilization on “vSAN-Datastore”.
Recommending Corrective Actions
Description: Based on monitoring results, recommend actions to address vSAN performance and capacity issues without disrupting other workloads.
Process:
- Resolve Disk Failure:
- Action: Replace the failed disk on host 192.168.1.11.
- In vCenter, navigate to Hosts and Clusters > 192.168.1.11 > Configure > vSAN > Disk Management.
- Remove the failed disk (Disk Groups > Remove Disk) and add a new disk.
- Allow vSAN to rebuild data (Monitor > vSAN > Resyncing Objects).
- Alternative: Evacuate data from 192.168.1.11 (vSAN > Disk Management > Evacuate Data) and place the host in maintenance mode if immediate replacement isn’t possible.
- Action: Replace the failed disk on host 192.168.1.11.
- Address High Latency:
- Action: After disk replacement, monitor latency in VCF Storage Operations (vSAN Performance dashboard).
- Verify database VMs (“database-01”, “database-02”) return to normal latency (<5ms).
- If latency persists, check storage policies (vCenter > Policies and Profiles > VM Storage Policies) for database VMs and ensure appropriate RAID levels (e.g., RAID-5 for performance).
- Address Capacity Utilization:
- Action: Add capacity to “vSAN-Datastore”.
- Add a new disk to an existing disk group (vSAN > Disk Management > Add Disk) or add a new host to “VVF-Cluster” (vCenter > Hosts and Clusters > Add Host).
- Alternative: Enable deduplication/compression (vSAN > Configure > Services > Enable Deduplication and Compression) to optimize space.
- Monitor capacity utilization in vSAN Capacity dashboard to ensure <80%.
- Action: Add capacity to “vSAN-Datastore”.
- Ensure No Disruption:
- Verify no impact to web servers, VDI desktops, or “Microservices-Namespace” pods (kubectl -n Microservices-Namespace get pods).
- Check VCF Operations for Logs (192.168.10.55) for errors (Explore Logs > source:vSAN).
Verification:
- Confirm disk replacement resolves health alerts and latency issues.
- Verify capacity utilization drops below 80% after adding disks or enabling deduplication.
- Ensure no disruptions to “VVF-Cluster” VMs or Kubernetes workloads.
Documentation Reference: vSAN corrective actions are covered in the vSphere 9.0 documentation under “vSphere Monitoring and Performance” https://techdocs.broadcom.com/us/en/vmware-cis/vsphere/vsphere/9-0/vsphere-monitoring-and-performance.html.Scenario Example: Recommend replacing the failed disk on 192.168.1.11, adjusting storage policies, and adding capacity to address vSAN issues.
Applying vSAN Monitoring to the Scenario
Detailed Process:
- Access VCF Storage Operations:
- Log in to https://192.168.10.54 and navigate to Environment > Inventory > vSAN.
- Monitor Health:
- Use vSAN Health dashboard to identify a disk failure on 192.168.1.11.
- Monitor Performance:
- Use vSAN Performance dashboard to identify high write latency (10ms) for database VMs.
- Monitor Capacity:
- Use vSAN Capacity dashboard to identify 85% utilization on “vSAN-Datastore”.
- Recommend Actions:
- Replace the failed disk on 192.168.1.11 and allow vSAN to rebuild.
- Adjust storage policies for database VMs if latency persists.
- Add a disk or enable deduplication to reduce capacity utilization.
- Verification:
- Confirm health alerts are resolved in vSAN Health.
- Verify latency drops below 5ms in vSAN Performance.
- Ensure capacity utilization is <80% in vSAN Capacity.
- Check no disruptions to VMs or Kubernetes pods.
Scenario Example: Use VCF Storage Operations to monitor “vSAN-Datastore”, identify a disk failure, high latency, and capacity issues, and recommend corrective actions without disrupting workloads.
Study Tip: Practice vSAN monitoring in VMware Hands-On Labs https://labs.hol.vmware.com/. Memorize the navigation path (Environment > Inventory > vSAN or Dashboards > VMware vSAN) and key metrics (health, latency, capacity).
Sample Exam Questions
- What is the purpose of VCF Storage Operations for vSAN monitoring?
A. Deploy new VMs
B. Monitor vSAN health, performance, and capacity
C. Configure NSX firewall rules
D. Manage Kubernetes namespaces
Answer: B. Monitor vSAN health, performance, and capacity. - How do you identify high latency for database VMs in VCF Storage Operations?
A. Check vCenter VM settings
B. Navigate to Dashboards > VMware vSAN > vSAN Performance and filter for database VMs
C. Use Explore Logs in VCF Operations for Logs
D. Edit vSAN storage policies
Answer: B. Navigate to Dashboards > VMware vSAN > vSAN Performance and filter for database VMs. - vSAN shows 90% capacity utilization. What should you do?
A. Disable vSAN services
B. Add a disk to a disk group or enable deduplication/compression
C. Reinstall the ESXi host
D. Disable DRS in the cluster
Answer: B. Add a disk to a disk group or enable deduplication/compression.
Final Words
Monitoring vSAN storage using VCF Storage Operations in VMware vSphere Foundation 9.0 is essential for maintaining storage health, performance, and capacity in the SDDC. This chapter covered using VCF Storage Operations to monitor “vSAN-Datastore”, identify issues like disk failures and high latency, and recommend corrective actions, preparing you for the 2V0-16.25 exam. We follow the official VMware Blueprint for the exam – VMware vSphere Foundation Administrator (PDF). Most of the work will be done here on this blog, and, in the end, the document will be released as a PDF, like the previous versions, at https://www.vladan.fr/vcp-vvf-administrator/. Stay tuned for the next part of Objective 4.3 or 4.2! Happy studying, and good luck on your VCP-VVF journey!
Download the study guide here.
More posts from ESX Virtualization:
- 5 New VMware Certifications for VVF and VCF
- VMware Alternative – OpenNebula: Powering Edge Clouds and GPU-Based AI Workloads with Firecracker and KVM
- Proxmox 9 (BETA 1) is out – What’s new?
- Another VMware Alternative Called Harvester – How does it compare to VMware?
- VMware vSphere 9 Standard and Enterprise Plus – Not Anymore?
- VMware vSphere Foundation (VVF 9) and VMware Cloud Foundation (VCF 9) Has been Released
- Vulnerability in your VMs – VMware Tools Update
- VMware ESXi FREE is FREE again!
- No more FREE licenses of VMware vSphere for vExperts – What’s your options?
- VMware Workstation 17.6.2 Pro does not require any license anymore (FREE)
- Migration from VMware to another virtualization platform with Veeam Backup and Replication
- Two New VMware Certified Professional Certifications for VMware administrators: VCP-VVF and VCP-VCF
- Patching ESXi Without Reboot – ESXi Live Patch – Yes, since ESXi 8.0 U3
- Update ESXi Host to the latest ESXi 8.0U3b without vCenter
- Upgrade your VMware VCSA to the latest VCSA 8 U3b – latest security patches and bug fixes
- VMware vSphere 8.0 U2 Released – ESXi 8.0 U2 and VCSA 8.0 U2 How to update
- What’s the purpose of those 17 virtual hard disks within VMware vCenter Server Appliance (VCSA) 8.0?
- VMware vSphere 8 Update 2 New Upgrade Process for vCenter Server details
- VMware vSAN 8 Update 2 with many enhancements announced during VMware Explore
- What’s New in VMware Virtual Hardware v21 and vSphere 8 Update 2?
- vSphere 8.0 Page
- ESXi 7.x to 8.x upgrade scenarios
- VMware vCenter Server 7.03 U3g – Download and patch
- Upgrade VMware ESXi to 7.0 U3 via command line
- VMware vCenter Server 7.0 U3e released – another maintenance release fixing vSphere with Tanzu
- What is The Difference between VMware vSphere, ESXi and vCenter
- How to Configure VMware High Availability (HA) Cluster
Leave a Reply