
Managing servers, storage, and networks can feel overhelming. Too many tools, too many dashboards. Xormon has been my go-to for bringing it all together. Xormon 2.0 was just released, with big updates. This release builds on what made Xormon great, adding smarter features to save you time. Let’s break down what’s new, how it improves on past versions, and why it’s a must for admins. But first, if you haven't heard about Xormon, I'll give you a short intro.
What is Xormon?
Xormon is a powerful, free (GPL) monitoring tool that brings your entire IT infrastructure into one single dashboard. It tracks servers, storage, and networks across platforms like VMware, Proxmox, Nutanix, Hyper-V or IBM Power Systems, and more, supporting vendors such as Dell EMC, Hitachi, and Pure Storage.
With agentless data collection and a lightweight OS Agent for deeper Linux insights, Xormon delivers real-time metrics, topology maps, and predictive analytics to spot issues like disk growth or network bottlenecks before they escalate. Its customizable interface, REST API, and Grafana integration make it a great choice for admins managing complex, hybrid environments, saving time and reducing tool sprawl. It can track your servers, your storage and your switches. All from a single dashboard.
Better Server Monitoring: IBM Power Systems, VMware, Nutanix and More
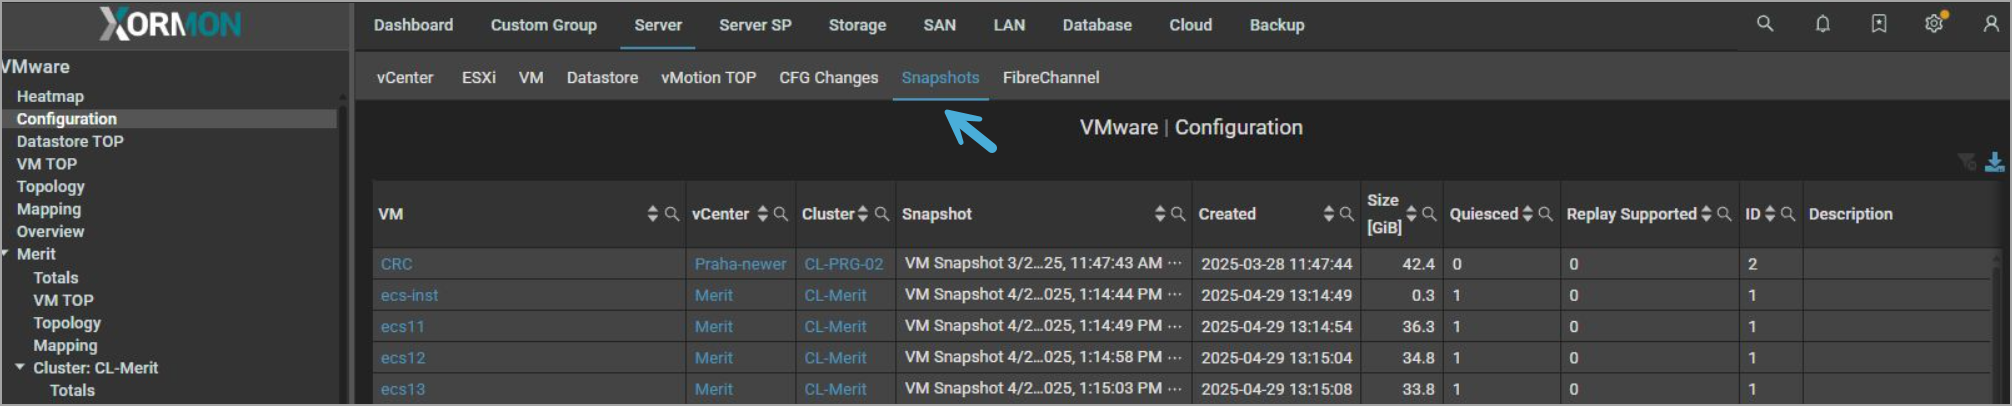
VMware fans, vCenter 9.x integration gets better. Active snapshot monitoring shows snapshot lists, sizes, and graphs for VM disk bloat (check it out here). SAN topology for ESXi-to-switch paths VMware Topology lets you trace data flows in one view. Proxmox users get a clean upgrade too. OS agent data now maps to VMs, showing CPU, memory, disk, and network in one tab. How it works? Agentless polling via APIs pulls data fast with low overhead. No manual exports needed.
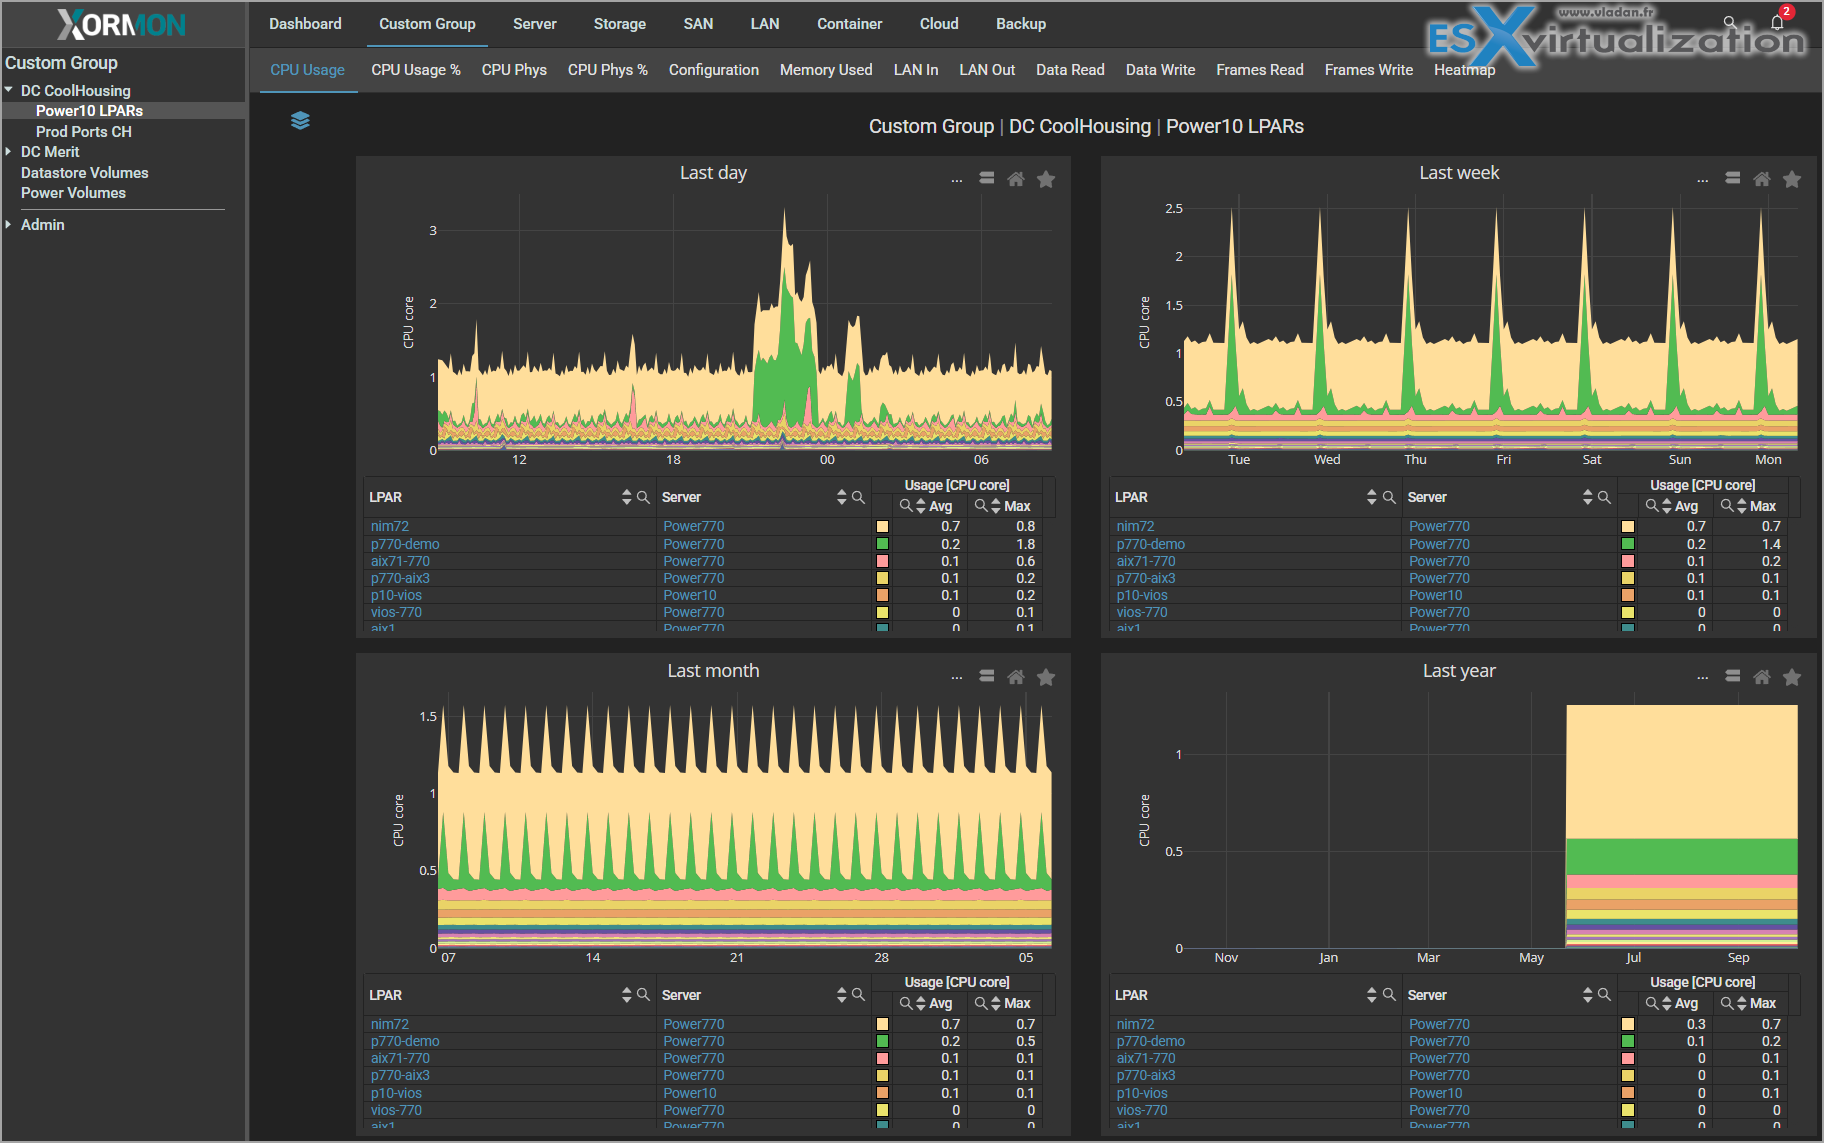
Xormon 2.0 steps up server monitoring. For IBM Power Systems, it now supports HMC 11. You get clear LAN topology maps showing SR-IOV, VLANs, and link setups.
AI Agent
You can interract with an AI assistant. Quick video below.
Favorites
Quickly save your shortcuts to the most frequently used items.
Single Sign-On (SSO support)
SSO is available in 2.0 release, and allow you to use Okta or Keycloak.
Network and OS: Catch Issues Fast
Network monitoring builds on past strengths. SAN/LAN metrics now show bits/sec and bytes/sec. Switches get uptime tracking and “Total Errors” graphs. LAN adds “Discards in/out” to spot packet drops and SFP Power graphs LAN SFP Power for transceiver health. Interswitch Links have dedicated graphs for Brocade, Cisco, and more.
OS Agents
Yes, there is a possibility to install a lightweight agent on critical systems to get more details. For Linux, the OS Agent pulls error logs from dmesg Error Log Monitoring, NFS stats via nfsiostat NFS Monitoring, and LVM topology Logical Volume Manager. These tie to VMs or databases.
HPE iLO gets new CPU and I/O graphs, and IBM Storage Protect (TSM) adds drive usage for backups.
UI and Reports: Easier and Faster
The interface gets polish. Graphs now handle weekly/monthly views with sharper detail. Zoom both ways, hide legends, and import Grafana tables Grafana Integration.
VM TOP supports custom time ranges, topologies export to PNG, and search covers all metrics.
The REST API adds alerting, cert management, and storage capacity endpoints. It’s optimized for big data, so no browser slowdowns.
New Technologies
from the 2.0 release notes:
- Storage
- Qumulo
- Scality RING
- Hitachi HNAS
- Microsoft Storage Spaces Direct (S2D)
- IBM FlashSystem 900/840
- Service processors
- Tape libraries
- IBM Z Mainframe / IBM LinuxONE: DPM mode
- Broadcom (Brocade) SAN switch via REST API
How It Builds on Past Xormon Releases
I’ve covered Xormon before here on ESX Virtualization Blog. Xormon 2.0 takes things further and there is clearly not enough space in this blog post to cover it all. In my Xormon NG 1.9.0 post, I loved the Veeam backup support for tracking jobs in one place. It also added IBM Storage Scale and Pure FlashBlade. Now, 2.0 ties backup data to storage growth, so you see how snapshots affect capacity.
My SAN topology post showed how Xormon maps storage-to-switch links with hover-over stats. 2.0 adds predictive fill rates and error graphs, making it easier to spot trouble before it hits.
And in my deep dive on NG 1.6, I highlighted IBM Power Pools and Red Hat Virtualization support, plus custom dashboards. The 2.0 improves with POWER11, better VMware snapshots, and faster UI for big setups.
Why Admins Will Love It
If you manage VMware, Proxmox, or IBM Power Systems with mixed storage like Pure or Hitachi, Xormon 2.0 is a lifesaver. It cuts tool-switching. Snapshots, backups, and storage growth? All connected. You can detect a VM eating disk space and fix it before alarms go off. The predictive fill rates mean no more surprise “out of space” alerts. It’s free (GPL), scales to big environments, and secure with API certs. Less false alerts, more time for real work like scripting or planning cloud moves. Check the latest bells and wistles in Xormon 2.0 here.
How to get XorMon 2.0?
Download link. Check out the demo site (without downloading and installing) at https://demo.xormon.com (login: xormon/xormon), where you can login remotely and play with the UI. The download comes with 2 months trial license, then it will be switched to the free edition with some restrictions.
XorMon is an Open-Source software
XorMon NG is published as free, open-source software under the General Public License version 3. You can download and use it as much as you want free of charge.
XORUX does provide just limited support services if you run into troubles while using XorMon. Support and guarantees are available on commercial terms from XORUX or their partners. There are also many resources you can use to learn XorMon and support yourself or get peer support online within Xorux forum and subreddit.
Final Words
It is a major release from Xorux. This new Xormon 2.0 is a big step up from past releases, keeping things simple but powerful. You can download and test by yourself. Xormon 2.0 is available in many different formats and can run on different OSes, within VMs or containers.
Video presentation of Xormon 2.0
More posts from ESX Virtualization:
- 5 New VMware Certifications for VVF and VCF
- VMware Alternative – OpenNebula: Powering Edge Clouds and GPU-Based AI Workloads with Firecracker and KVM
- Proxmox 9 (BETA 1) is out – What’s new?
- Another VMware Alternative Called Harvester – How does it compare to VMware?
- VMware vSphere 9 Standard and Enterprise Plus – Not Anymore?
- VMware vSphere Foundation (VVF 9) and VMware Cloud Foundation (VCF 9) Has been Released
- Vulnerability in your VMs – VMware Tools Update
- VMware ESXi FREE is FREE again!
- No more FREE licenses of VMware vSphere for vExperts – What’s your options?
- VMware Workstation 17.6.2 Pro does not require any license anymore (FREE)
- Migration from VMware to another virtualization platform with Veeam Backup and Replication
- Patching ESXi Without Reboot – ESXi Live Patch – Yes, since ESXi 8.0 U3
- Update ESXi Host to the latest ESXi 8.0U3b without vCenter
- Upgrade your VMware VCSA to the latest VCSA 8 U3b – latest security patches and bug fixes
- VMware vSphere 8.0 U2 Released – ESXi 8.0 U2 and VCSA 8.0 U2 How to update
- What’s the purpose of those 17 virtual hard disks within VMware vCenter Server Appliance (VCSA) 8.0?
- VMware vSphere 8 Update 2 New Upgrade Process for vCenter Server details
- What’s New in VMware Virtual Hardware v21 and vSphere 8 Update 2?
- vSphere 8.0 Page
- ESXi 7.x to 8.x upgrade scenarios
- What is The Difference between VMware vSphere, ESXi and vCenter
- How to Configure VMware High Availability (HA) Cluster
Leave a Reply