
Monitoring of heterogeneous environments has always been difficult – or at least it was before tools like XorMon came along. If you manage VMware, Nutanix, IBM Power, storage from several vendors, Oracle databases, LAN/SAN, backups and more, you know the pain of jumping between five different consoles. XorMon from Xorux solves that by putting everything into one modern, single pane of glass.
I’ve written about Xorux products for years – from the original LPAR2RRD and STOR2RRD days all the way through to XorMon NG. You can find some of those earlier posts here:
- Introducing Xormon NG 1.0
- Unleashing the Power of XorMon
- Xormon NG – A great monitoring tool for virtualization admins
XorMon 2.4.0 just went out, the 15th of October. Here’s the technical rundown based on the official notes.
Support for new technologies
Every release expands the already long list of supported platforms. This time we get:
- Server: Huawei FusionCompute
- Server processors: Dell OpenManage, Supermicro, Cisco UCS
- Storage: Hitachi Ops Center, Cloudian, TrueNAS SCALE
- LAN: HPE Juniper, F5, Palo Alto
- Backup / Tape: Cybernetics ISAN VTL
All native – no heavy agents or middleware required for most of them.
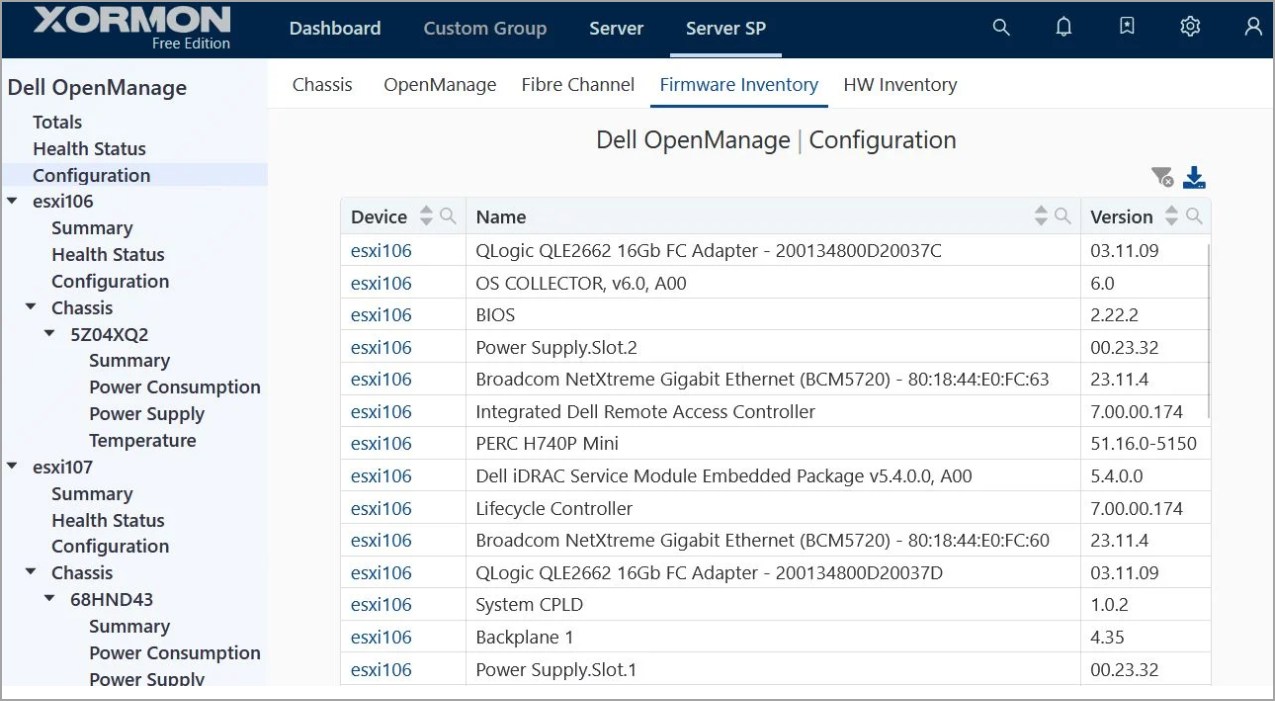
Screenshot from Xorux
Major feature enhancements
These are the bigger jumps:
- OpenTelemetry exporter – so you can push metrics into the rest of your observability stack.
- AI agent (Xbot) significantly enhanced – ask questions in plain language and get real answers instead of clicking through dashboards.
- Oracle Database – huge enhancements and optimizations:
- ASM monitoring now includes topology
- SQL statements monitoring
- ~70 % of the original metrics now kept as 1-minute samples (was 5-minute)
- Queries rewritten and optimized – lower impact on the database even with many new metrics
- Latency graphs under Instances completely rebuilt
- New subsystems: Alert history, Session (blocking / long-running), Service, SQL Query, Waitclass, DataGuard
- Topology improved with a preview panel – you can now see performance graphs and configuration of the items shown.
- LAN: NetFlow / sFlow support added.
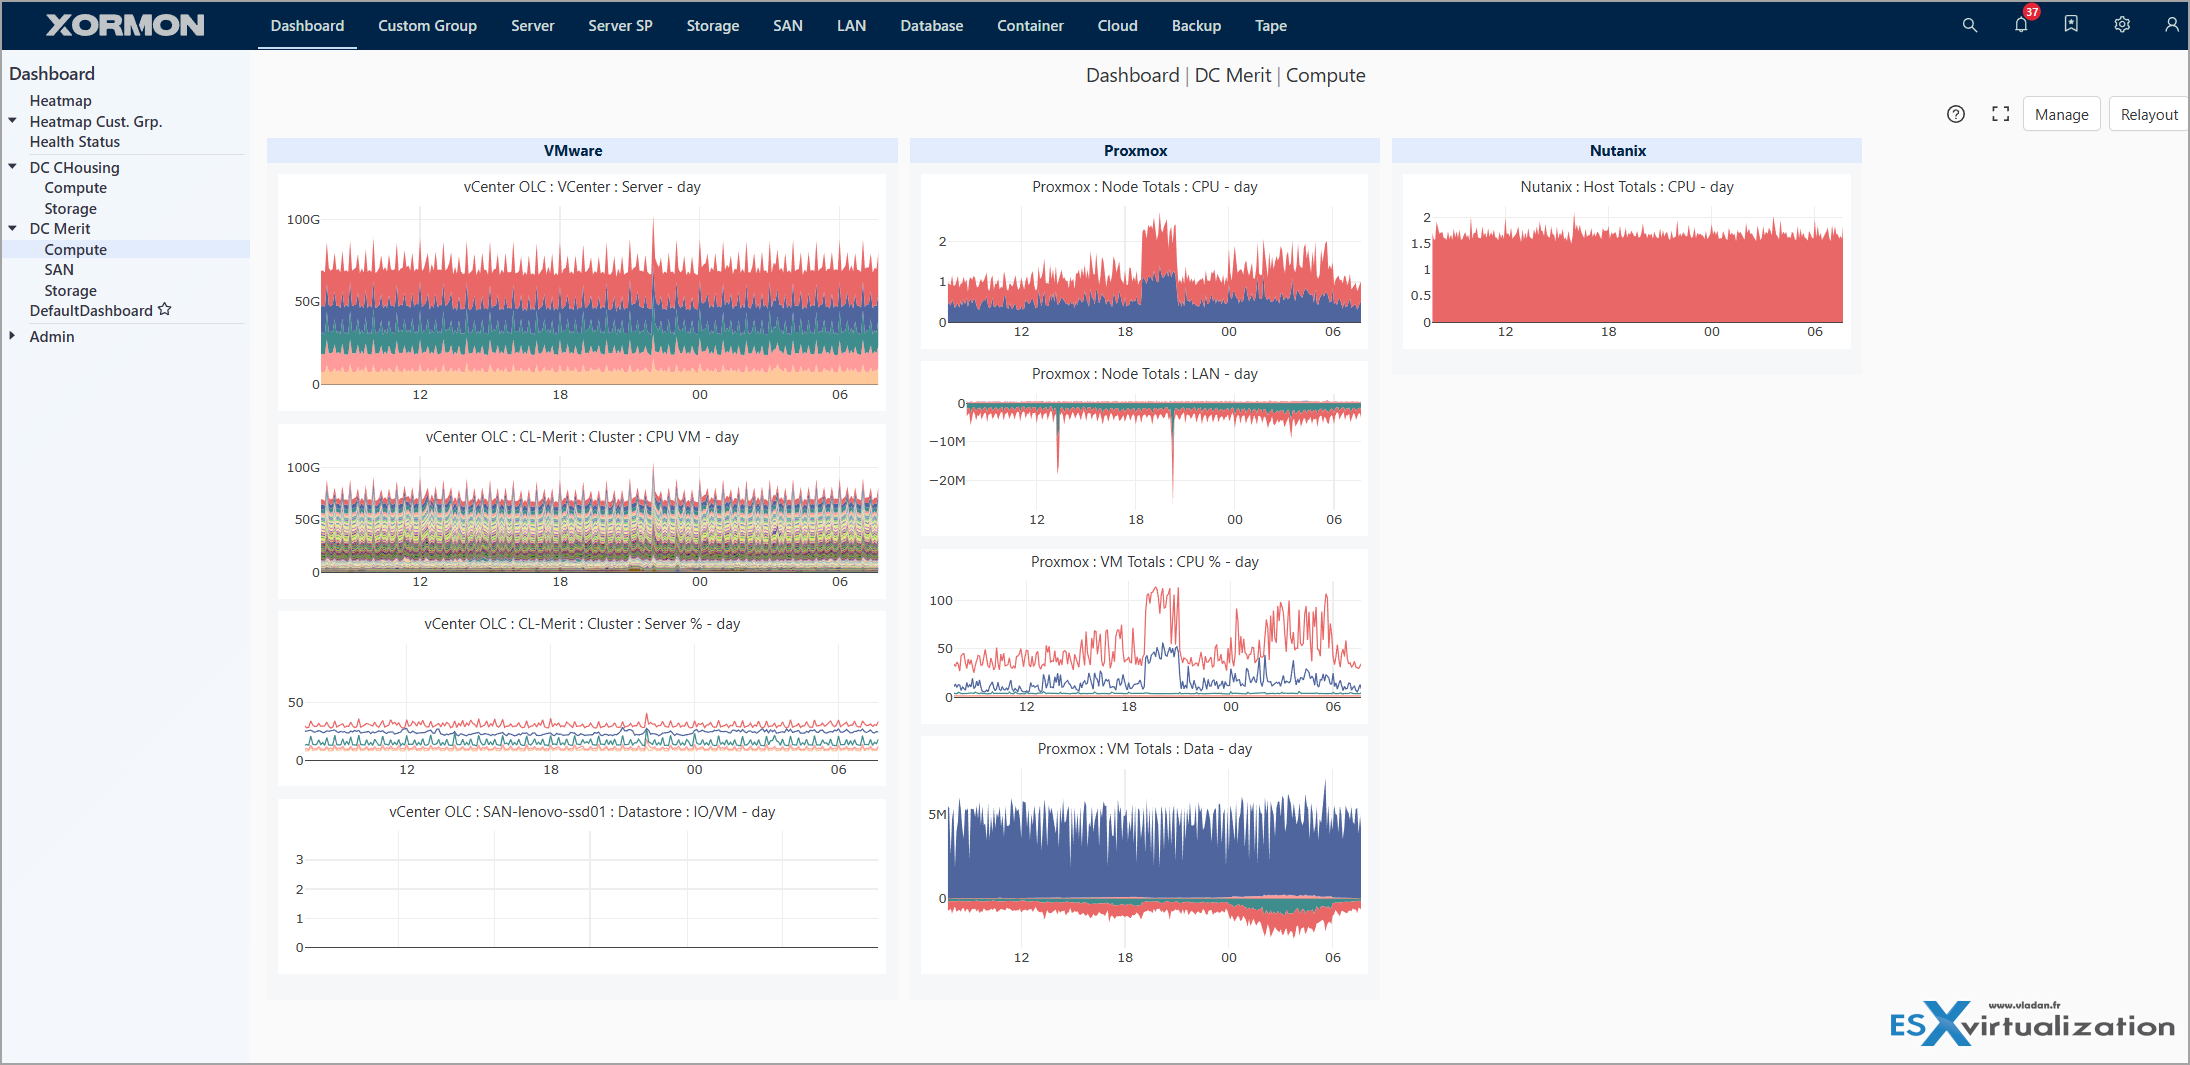
Screenshot from Xorux
Other useful enhancements (selected)
Servers & OS agents – Topology added for RHV/OLVM/oVirt, Windows, Linux and XenServer/XCP-ng. New dedicated XorMon AIX agent. Process list snapshot (“PS Snap”) once an hour with one-week retention, plus process collection triggered by CPU alerts. Multipath topology and error-based alerting. New OS agent health dashboard.
Storage – Plenty of new metrics and fixes for NetApp, Dell EMC PowerMAX/VMAX, Unity, IBM FlashSystem, Spectrum Scale, EverPure, NetApp E/F-series (snapshot monitoring) and others.
Product-level – Dashboard improvements (alerting tables, device-based templates, autoplay), alerting timeline view, nested custom groups, regex-based tags, new Grafana plugin integration, Performance Views for Server/SAN/LAN/Storage, trends summary pages, and more.
Why Open Source still matters
XorMon is published under the GPL v3. You can download it, run it on-premises, look at the source code and use the free edition with no time limit. No per-device licensing tax, no forced cloud, no proprietary black-box collectors for the majority of platforms. That combination of depth (140+ technologies) and true open-source licensing is still rare.
Support options and the Pro / Enterprise edition – why they matter for real enterprises
The free edition is excellent for labs, smaller environments or proof-of-concept work. But if you run multi-hardware, multi-platform infrastructure (VMware + Nutanix + IBM Power + several storage arrays + Oracle DBs + backups), the commercial support contract and the Enterprise (Pro) edition become important.
With the support contract you get the unrestricted Enterprise edition – unlimited devices, full advanced alerting, Grafana integration, full topology, REST API, OpenTelemetry and the rest of the enterprise features. More importantly, you get real human support from the people who actually write the code. In a complex environment that means faster root-cause analysis when something goes wrong, help with custom reports or health checks, and guidance on best practices so you catch capacity or performance problems before they turn into downtime.
Good alerting and predictive capacity features only help if they are reliable and if you can get help when you need it. For enterprises that cannot afford “best effort” community support, the paid option turns XorMon from a useful free tool into a production-grade monitoring platform that helps avoid outages across the whole stack.
How to get started?
Getting started is straightforward. Go to the official site https://xormon.com, pick the package that fits your environment (Linux tarball, VMware OVA, Hyper-V image or Docker), and follow the installation documentation. You can also try the online demo first (login details are on the site) without installing anything.
The download includes a trial of the full Enterprise features so you can evaluate everything; after the trial period it switches to the free edition with the usual limits. If you are upgrading from an older version, read the upgrade notes carefully (especially any dependency requirements from previous releases).
Once it is running, connect your first devices (vCenter, storage arrays, databases, etc.) – most of them are agentless – and you will start seeing data and topology maps fairly quickly. For production use in larger environments, consider the support contract so you get the unrestricted edition and proper help when you need it.
How to get it
Head over to the official site: https://xormon.com
Release notes for 2.4.0: https://xormon.com/note240.php
Oracle deep-dive page: https://xormon.com/database/monitoring/Oracle-DB/Oracle-monitoring-XorMon-240.php
If you are still on the older LPAR2RRD / STOR2RRD / XorMon Original tools, this is another good reason to plan the move. Those products still receive bug fixes, but all the new development goes into XorMon.
As usual, test in a lab first and follow the official upgrade documentation. The Xorux team keeps shipping solid, operator-focused features at a steady pace – exactly what we need in heterogeneous environments.
More posts from ESX Virtualization:
- How to update your ESXi 7.x or 8.x to the latest ESXi 8.0U3k via command line
- Veeam Bare Metal Recovery from Recovery partition
- Veeam Backup and Replication Upgrade on Windows – Yes we can
- Securing Your Backups On-Premises: How StarWind VTL Fits Perfectly with Veeam and the 3-2-1 Rule
- VMware Alternative – OpenNebula: Powering Edge Clouds and GPU-Based AI Workloads with Firecracker and KVM
- Another VMware Alternative Called Harvester – How does it compare to VMware?
- VMware vSphere 9 Standard and Enterprise Plus – Not Anymore?
- Vulnerability in your VMs – VMware Tools Update
- VMware ESXi FREE is FREE again!
- No more FREE licenses of VMware vSphere for vExperts – What’s your options?
- VMware Workstation 17.6.2 Pro does not require any license anymore (FREE)
- Two New VMware Certified Professional Certifications for VMware administrators: VCP-VVF and VCP-VCF
- Patching ESXi Without Reboot – ESXi Live Patch – Yes, since ESXi 8.0 U3
- Update ESXi Host to the latest ESXi 8.0U3b without vCenter
- Upgrade your VMware VCSA to the latest VCSA 8 U3b – latest security patches and bug fixes
- VMware vSphere 8.0 U2 Released – ESXi 8.0 U2 and VCSA 8.0 U2 How to update
- What’s the purpose of those 17 virtual hard disks within VMware vCenter Server Appliance (VCSA) 8.0?
- VMware vSphere 8 Update 2 New Upgrade Process for vCenter Server details
- What’s New in VMware Virtual Hardware v21 and vSphere 8 Update 2?
- vSphere 8.0 Page
- ESXi 7.x to 8.x upgrade scenarios
- VMware vCenter Server 7.03 U3g – Download and patch
- Upgrade VMware ESXi to 7.0 U3 via command line
- VMware vCenter Server 7.0 U3e released – another maintenance release fixing vSphere with Tanzu
- What is The Difference between VMware vSphere, ESXi and vCenter
- How to Configure VMware High Availability (HA) Cluster
Stay tuned through RSS, and social media channels (Twitter, FB, YouTube)





Leave a Reply